
Page 145 - Read Online
P. 145
Sun et al. Vessel Plus 2020;4:13 I http://dx.doi.org/10.20517/2574-1209.2020.02 Page 5 of 13
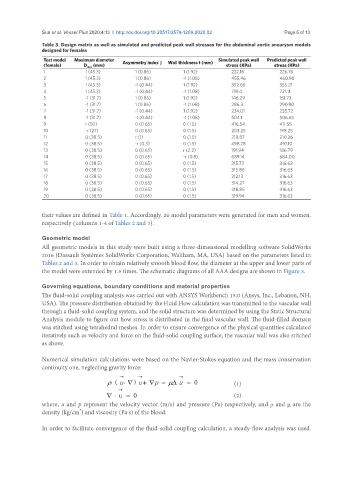
Table 3. Design matrix as well as simulated and predicted peak wall stresses for the abdominal aortic aneurysm models
designed for females
Test model Maximum diameter Asymmetry index β Wall thickness t (mm) Simulated peak wall Predicted peak wall
(female) D max (mm) stress (KPa) stress (KPa)
1 1 (45.3) 1 (0.86) 1 (1.92) 222.16 226.76
2 1 (45.3) 1 (0.86) -1 (1.08) 455.46 460.90
3 1 (45.3) -1 (0.44) 1 (1.92) 352.66 355.21
4 1 (45.3) -1 (0.44) -1 (1.08) 719.4 721.11
5 -1 (31.7) 1 (0.86) 1 (1.92) 146.29 151.73
6 -1 (31.7) 1 (0.86) -1 (1.08) 286.3 290.90
7 -1 (31.7) -1 (0.44) 1 (1.92) 234.01 235.72
8 -1 (31.7) -1 (0.44) -1 (1.08) 504.1 506.65
9 r (50) 0 (0.65) 0 (1.5) 416.54 411.55
10 -r (27) 0 (0.65) 0 (1.5) 203.25 198.25
11 0 (38.5) r (1) 0 (1.5) 218.87 210.26
12 0 (38.5) -r (0.3) 0 (1.5) 498.78 497.10
13 0 (38.5) 0 (0.65) r (2.2) 191.94 186.79
14 0 (38.5) 0 (0.65) -r (0.8) 689.14 684.00
15 0 (38.5) 0 (0.65) 0 (1.5) 315.72 316.63
16 0 (38.5) 0 (0.65) 0 (1.5) 315.86 316.63
17 0 (38.5) 0 (0.65) 0 (1.5) 312.13 316.63
18 0 (38.5) 0 (0.65) 0 (1.5) 314.27 316.63
19 0 (38.5) 0 (0.65) 0 (1.5) 318.85 316.63
20 0 (38.5) 0 (0.65) 0 (1.5) 319.94 316.63
their values are defined in Table 1. Accordingly, 20 model parameters were generated for men and women,
respectively (columns 1-4 of Tables 2 and 3).
Geometric model
All geometric models in this study were built using a three-dimensional modelling software SolidWorks
2016 (Dassault Systèmes SolidWorks Corporation, Waltham, MA, USA) based on the parameters listed in
Tables 2 and 3. In order to obtain relatively smooth blood flow, the diameter at the upper and lower parts of
the model were extended by 1.5 times. The schematic diagrams of all AAA designs are shown in Figure 3.
Governing equations, boundary conditions and material properties
The fluid-solid coupling analysis was carried out with ANSYS Workbench 15.0 (Ansys, Inc., Lebanon, NH,
USA). The pressure distribution obtained by the Fluid Flow calculation was transmitted to the vascular wall
through a fluid-solid coupling system, and the solid structure was determined by using the Static Structural
Analysis module to figure out how stress is distributed in the final vascular wall. The fluid-filled domain
was stitched using tetrahedral meshes. In order to ensure convergence of the physical quantities calculated
iteratively such as velocity and force on the fluid-solid coupling surface, the vascular wall was also stitched
as above.
Numerical simulation calculations were based on the Navier-Stokes equation and the mass conservation
continuity one, neglecting gravity force:
→ → →
ρ ( ⋅ ∇ ) + ∇p − µ ∆ u = 0 (1)
u
u
→
∇ ⋅ u = 0 (2)
where, u and p represent the velocity vector (m/s) and pressure (Pa) respectively, and ρ and μ are the
3
density (kg/cm ) and viscosity (Pa·s) of the blood.
In order to facilitate convergence of the fluid-solid coupling calculation, a steady-flow analysis was used.