
Page 146 - Read Online
P. 146
Page 6 of 13 Sun et al. Vessel Plus 2020;4:13 I http://dx.doi.org/10.20517/2574-1209.2020.02
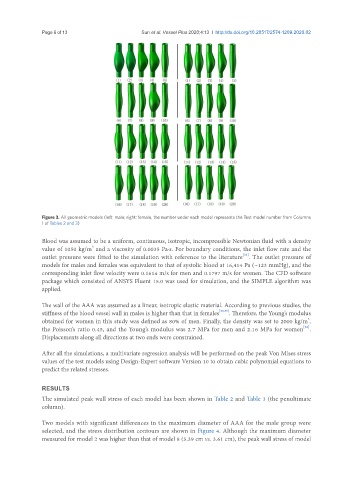
Figure 3. All geometric models (left: male; right: female, the number under each model represents the Test model number from Columns
1 of Tables 2 and 3)
Blood was assumed to be a uniform, continuous, isotropic, incompressible Newtonian fluid with a density
3
value of 1050 kg/m and a viscosity of 0.0035 Pa·s. For boundary conditions, the inlet flow rate and the
[33]
outlet pressure were fitted to the simulation with reference to the literature . The outlet pressure of
models for males and females was equivalent to that of systolic blood at 16,414 Pa (~123 mmHg), and the
corresponding inlet flow velocity were 0.1614 m/s for men and 0.1797 m/s for women. The CFD software
package which consisted of ANSYS Fluent 15.0 was used for simulation, and the SIMPLE algorithm was
applied.
The wall of the AAA was assumed as a linear, isotropic elastic material. According to previous studies, the
stiffness of the blood vessel wall in males is higher than that in females [34,35] . Therefore, the Young’s modulus
3
obtained for women in this study was defined as 80% of men. Finally, the density was set to 2000 kg/m ,
[36]
the Poisson’s ratio 0.45, and the Young’s modulus was 2.7 MPa for men and 2.16 MPa for women .
Displacements along all directions at two ends were constrained.
After all the simulations, a multivariate regression analysis will be performed on the peak Von Mises stress
values of the test models using Design-Expert software Version 10 to obtain cubic polynomial equations to
predict the related stresses.
RESULTS
The simulated peak wall stress of each model has been shown in Table 2 and Table 3 (the penultimate
column).
Two models with significant differences in the maximum diameter of AAA for the male group were
selected, and the stress distribution contours are shown in Figure 4. Although the maximum diameter
measured for model 2 was higher than that of model 8 (5.39 cm vs. 3.61 cm), the peak wall stress of model