
Page 147 - Read Online
P. 147
Sun et al. Vessel Plus 2020;4:13 I http://dx.doi.org/10.20517/2574-1209.2020.02 Page 7 of 13
Figure 4. Stress distribution in models 2 and 8 of the male group. A: anterior; P: posterior
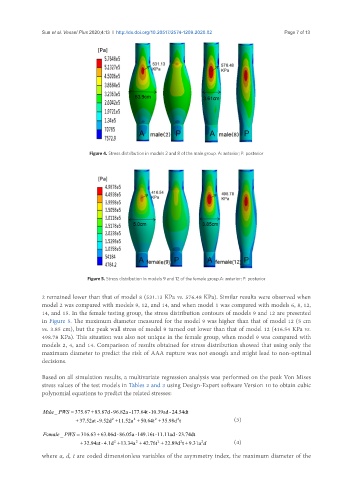
Figure 5. Stress distribution in models 9 and 12 of the female group.A: anterior; P: posterior
2 remained lower than that of model 8 (531.13 KPa vs. 576.48 KPa). Similar results were observed when
model 2 was compared with models 9, 12, and 14, and when model 1 was compared with models 6, 8, 12,
14, and 15. In the female testing group, the stress distribution contours of models 9 and 12 are presented
in Figure 5. The maximum diameter measured for the model 9 was higher than that of model 12 (5 cm
vs. 3.85 cm), but the peak wall stress of model 9 turned out lower than that of model 12 (416.54 KPa vs.
498.78 KPa). This situation was also not unique in the female group, when model 9 was compared with
models 2, 4, and 14. Comparison of results obtained for stress distribution showed that using only the
maximum diameter to predict the risk of AAA rupture was not enough and might lead to non-optimal
decisions.
Based on all simulation results, a multivariate regression analysis was performed on the peak Von Mises
stress values of the test models in Tables 2 and 3 using Design-Expert software Version 10 to obtain cubic
polynomial equations to predict the related stresses:
M ale _ PWS = 375.67 + 83.87d - 96.82a - 177.64t - 10.39ad - 24.54dt
+ 37.52at - 9.52d 2 + 11.52a 2 + 50.64t 2 + 35.98d 2 t (3)
Fe male _ PWS = 316.63 + 63.06d - 86.05a - 149.16t - 11.11ad - 23.74dt
+ 32.94at - 4.1d 2 + 13.34a 2 + 42.76t 2 + 22.89d 2 t + 9.31a 2 d (4)
where a, d, t are coded dimensionless variables of the asymmetry index, the maximum diameter of the