
Page 143 - Read Online
P. 143
Sun et al. Vessel Plus 2020;4:13 I http://dx.doi.org/10.20517/2574-1209.2020.02 Page 3 of 13
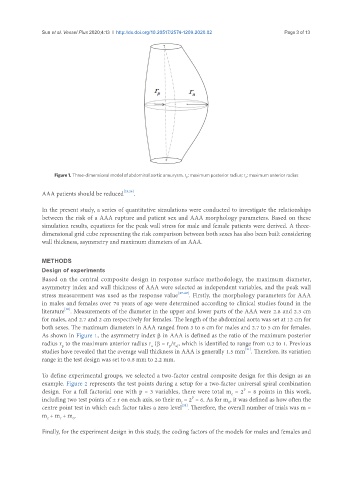
Figure 1. Three-dimensional model of abdominal aortic aneurysm. r p : maximum posterior radius; r a : maximum anterior radius
AAA patients should be reduced [25,26] .
In the present study, a series of quantitative simulations were conducted to investigate the relationships
between the risk of a AAA rupture and patient sex and AAA morphology parameters. Based on these
simulation results, equations for the peak wall stress for male and female patients were derived. A three-
dimensional grid cube representing the risk comparison between both sexes has also been built considering
wall thickness, asymmetry and maximum diameters of an AAA.
METHODS
Design of experiments
Based on the central composite design in response surface methodology, the maximum diameter,
asymmetry index and wall thickness of AAA were selected as independent variables, and the peak wall
stress measurement was used as the response value [27-29] . Firstly, the morphology parameters for AAA
in males and females over 70 years of age were determined according to clinical studies found in the
[30]
literature . Measurements of the diameter in the upper and lower parts of the AAA were 2.8 and 2.3 cm
for males, and 2.7 and 2 cm respectively for females. The length of the abdominal aorta was set at 12 cm for
both sexes. The maximum diameters in AAA ranged from 3 to 6 cm for males and 2.7 to 5 cm for females.
As shown in Figure 1, the asymmetry index β in AAA is defined as the ratio of the maximum posterior
radius r to the maximum anterior radius r (β = r /r , which is identified to range from 0.3 to 1. Previous
a)
p
p
a
[31]
studies have revealed that the average wall thickness in AAA is generally 1.5 mm . Therefore, its variation
range in the test design was set to 0.8 mm to 2.2 mm.
To define experimental groups, we selected a two-factor central composite design for this design as an
example. Figure 2 represents the test points during a setup for a two-factor universal spiral combination
design. For a full factorial one with p = 3 variables, there were total m = 2 = 8 points in this work,
p
c
p
including two test points of ± r on each axis, so their m = 2 = 6. As for m , it was defined as how often the
r
0
centre point test in which each factor takes a zero level . Therefore, the overall number of trials was m =
[32]
m + m + m .
r
c
0
Finally, for the experiment design in this study, the coding factors of the models for males and females and