
Page 33 - Read Online
P. 33
Bilovol Arterial hypertension and type 2 diabetes progression
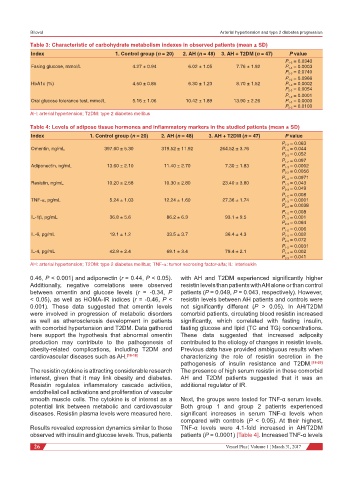
Table 3: Characteristic of carbohydrate metabolism indexes in observed patients (mean ± SD)
Index 1. Control group (n = 20) 2. AH (n = 48) 3. AH + T2DM (n = 47) P value
P 1-2 = 0.0340
Fasing glucose, mmol/L 4.27 ± 0.94 6.02 ± 1.05 7.76 ± 1.92 P 1-3 = 0.0003
P 2-3 = 0.0740
P 1-2 = 0.0966
HbA1c (%) 4.50 ± 0.85 6.30 ± 1.23 8.70 ± 1.52 P 1-3 = 0.0002
P 2-3 = 0.0054
P 1-2 = 0.0001
Oral glucose tolerance test, mmol/L 5.16 ± 1.06 10.42 ± 1.89 13.90 ± 2.26 P 1-3 = 0.0000
P 2-3 = 0.0100
AH: arterial hypertension; T2DM: type 2 diabetes mellitus
Table 4: Levels of adipose tissue hormones and inflammatory markers in the studied patients (mean ± SD)
Index 1. Control group (n = 20) 2. AH (n = 48) 3. AH + T2DM (n = 47) P value
P 1-2 = 0.063
Omentin, ng/mL 397.60 ± 5.30 319.52 ± 11.92 264.52 ± 3.76 P 1-3 = 0.044
P 2-3 = 0.052
P 1-2 = 0.097
Adiponectin, ng/mL 13.60 ± 2.10 11.40 ± 2.70 7.30 ± 1.83 P 1-3 = 0.0002
P 2-3 = 0.0056
P 1-2 = 0.0971
Resistin, ng/mL 10.20 ± 2.58 10.30 ± 2.80 23.40 ± 3.80 P 1-3 = 0.043
P 2-3 = 0.049
P 1-2 = 0.008
TNF-α, pg/mL 5.24 ± 1.03 12.24 ± 1.60 27.36 ± 1.74 P 1-3 = 0.0001
P 2-3 = 0.0038
P 1-2 = 0.008
IL-1β, pg/mL 36.8 ± 5.6 86.2 ± 6.3 93.1 ± 9.5 P 1-3 = 0.001
P 2-3 = 0.064
P 1-2 = 0.006
IL-6, pg/mL 19.1 ± 1.2 33.5 ± 3.7 36.4 ± 4.3 P 1-3 = 0.002
P 2-3 = 0.072
P 1-2 = 0.0031
IL-4, pg/mL 42.9 ± 2.4 69.1 ± 3.4 79.4 ± 2.1 P 1-3 = 0.002
P 2-3 = 0.041
AH: arterial hypertension; T2DM: type 2 diabetes mellitus; TNF-α: tumor necrosing factor-alfa; IL: interleukin
0.46, P < 0.001) and adiponectin (r = 0.44, P < 0.05). with AH and T2DM experienced significantly higher
Additionally, negative correlations were observed resistin levels than patients with AH alone or than control
between omentin and glucose levels (r = -0.34, P patients (Р = 0.049, Р = 0.043, respectively). However,
< 0.05), as well as HOMA-IR indices (r = -0.46, P < resistin levels between AH patients and controls were
0.001). These data suggested that omentin levels not significantly different (P > 0.05). In AH/T2DM
were involved in progression of metabolic disorders comorbid patients, circulating blood resistin increased
as well as atherosclerosis development in patients significantly, which correlated with fasting insulin,
with comorbid hypertension and T2DM. Data gathered fasting glucose and lipid (TC and TG) concentrations.
here support the hypothesis that abnormal omentin These data suggested that increased adiposity
production may contribute to the pathogenesis of contributed to the etiology of changes in resistin levels.
obesity-related complications, including T2DM and Previous data have provided ambiguous results when
cardiovascular diseases such as AH. [16-18] characterizing the role of resistin secretion in the
pathogenesis of insulin resistance and T2DM. [18-20]
The resistin cytokine is attracting considerable research The presence of high serum resistin in these comorbid
interest, given that it may link obesity and diabetes. AH and T2DM patients suggested that it was an
Resistin regulates inflammatory cascade activities, additional regulator of IR.
endothelial cell activations and proliferation of vascular
smooth muscle cells. The cytokine is of interest as a Next, the groups were tested for TNF-α serum levels.
potential link between metabolic and cardiovascular Both group 1 and group 2 patients experienced
diseases. Resistin plasma levels were measured here. significant increases in serum TNF-α levels when
compared with controls (P < 0.05). At their highest,
Results revealed expression dynamics similar to those TNF-α levels were 4.1-fold increased in AH/T2DM
observed with insulin and glucose levels. Thus, patients patients (Р = 0.0001) [Table 4]. Increased TNF-α levels
26 Vessel Plus ¦ Volume 1 ¦ March 31, 2017