
Page 32 - Read Online
P. 32
Bilovol Arterial hypertension and type 2 diabetes progression
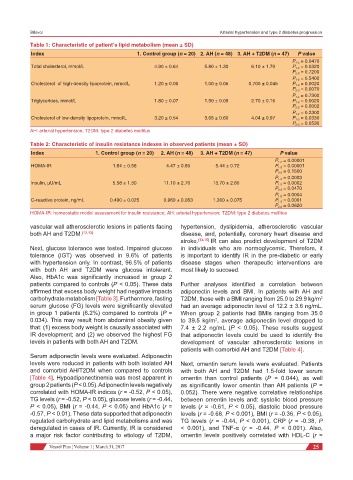
Table 1: Characteristic of patient’s lipid metabolism (mean ± SD)
Index 1. Control group (n = 20) 2. AH (n = 48) 3. AH + T2DM (n = 47) P value
P 1-2 = 0.0470
Total cholesterol, mmol/L 4.90 ± 0.64 5.80 ± 1.30 6.10 ± 1.70 P 1-3 = 0.0320
P 2-3 = 0.7200
P 1-2 = 0.5400
Cholesterol of high-density lipoprotein, mmol/L 1.20 ± 0.06 1.00 ± 0.05 0.700 ± 0.045 P 1-3 = 0.0020
P 2-3 = 0.0070
P 1-2 = 0.7300
Triglycerides, mmol/L 1.80 ± 0.07 1.90 ± 0.09 2.70 ± 0.16 P 1-3 = 0.0020
P 2-3 = 0.0002
P 1-2 = 0.2300
Cholesterol of low-density lipoprotein, mmol/L 3.20 ± 0.54 3.68 ± 0.60 4.04 ± 0.97 P 1-3 = 0.0330
P 2-3 = 0.0530
AH: arterial hypertension; T2DM: type 2 diabetes mellitus
Table 2: Characteristic of insulin resistance indexes in observed patients (mean ± SD)
Index 1. Control group (n = 20) 2. AH (n = 48) 3. AH + T2DM (n = 47) P value
P 1-2 = 0.00001
HOMA-IR 1.64 ± 0.56 4.47 ± 0.60 5.44 ± 0.72 P 1-3 = 0.00001
P 2-3 = 0.1500
P 1-2 = 0.0003
Insulin, µU/mL 5.58 ± 1.30 11.10 ± 2.70 13.70 ± 2.60 P 1-3 = 0.0002
P 2-3 = 0.0470
P 1-2 = 0.0004
C-reactive protein, ng/mL 0.490 ± 0.025 0.960 ± 0.053 1.300 ± 0.075 P 1-3 = 0.0001
P 2-3 = 0.0620
HOMA-IR: homeostatic model assessment for insulin resistance; AH: arterial hypertension; T2DM: type 2 diabetes mellitus
vascular wall atherosclerotic lesions in patients facing hypertension, dyslipidemia, atherosclerotic vascular
both AH and T2DM. [12,13] disease, and, potentially, coronary heart disease and
stroke. [13-15] IR can also predict development of T2DM
Next, glucose tolerance was tested. Impaired glucose in individuals who are normoglycemic. Therefore, it
tolerance (IGT) was observed in 9.6% of patients is important to identify IR in the pre-diabetic or early
with hypertension only. In contrast, 96.5% of patients disease stages when therapeutic interventions are
with both AH and T2DM were glucose intolerant. most likely to succeed.
Also, HbA1c was significantly increased in group 2
patients compared to controls (P < 0.05). These data Further analyses identified a correlation between
affirmed that excess body weight had negative impacts adiponectin levels and BMI. In patients with AH and
carbohydrate metabolism [Table 3]. Furthermore, fasting T2DM, those with a BMI ranging from 25.0 to 29.9 kg/m
2
serum glucose (FG) levels were significantly elevated had an average adiponectin level of 12.2 ± 3.6 ng/mL.
in group 1 patients (6.2%) compared to controls (Р = When group 2 patients had BMIs ranging from 35.0
0.034). This may result from abdominal obesity given to 39.5 kg/m , average adiponectin level dropped to
2
that: (1) excess body weight is causally associated with 7.4 ± 2.2 ng/mL (P < 0.05). These results suggest
IR development; and (2) we observed the highest FG that adiponectin levels could be used to identify the
levels in patients with both AH and T2DM. development of vascular atherosclerotic lesions in
patients with comorbid AH and T2DM [Table 4].
Serum adiponectin levels were evaluated. Adiponectin
levels were reduced in patients with both isolated AH Next, omentin serum levels were evaluated. Patients
and comorbid AH/T2DM when compared to controls with both AH and T2DM had 1.5-fold lower serum
[Table 4]. Hypoadiponectinemia was most apparent in omentin than control patients (Р = 0.044), as well
group 2 patients (P < 0.05). Adiponectin levels negatively as significantly lower omentin than AH patients (P =
correlated with HOMA-IR indices (r = -0.52, P < 0.05), 0.052). There were negative correlative relationships
TG levels (r = -0.52, P < 0.05), glucose levels (r = -0.44, between omentin levels and: systolic blood pressure
P < 0.05), BMI (r = -0.44, P < 0.05) and HbA1c (r = levels (r = -0.61, P < 0.05), diastolic blood pressure
-0.57, P < 0.01). These data supported that adiponectin levels (r = -0.68, P < 0.001), BMI (r = -0.36, P < 0.05),
regulated carbohydrate and lipid metabolisms and was TG levels (r = -0.44, P < 0.001), CRP (r = -0.38, P
deregulated in cases of IR. Currently, IR is considered < 0.001), and TNF-α (r = -0.44, P < 0.001). Also,
a major risk factor contributing to etiology of T2DM, omentin levels positively correlated with HDL-C (r =
Vessel Plus ¦ Volume 1 ¦ March 31, 2017 25