
Page 80 - Read Online
P. 80
Rao. Vessel Plus 2022;6:24 https://dx.doi.org/10.20517/2574-1209.2021.91 Page 13 of 23
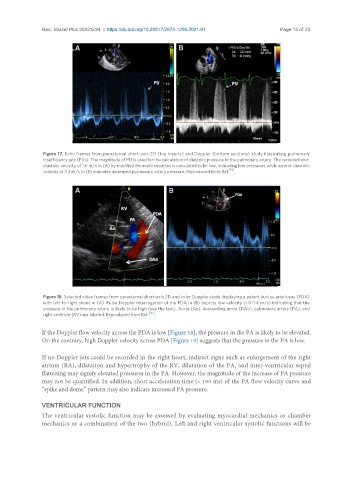
Figure 17. Echo frames from parasternal short-axis 2D (top inserts) and Doppler (bottom sections) study illustrating pulmonary
insufficiency jets (PIJs). The magnitude of PIJ is used for the calculation of diastolic pressure in the pulmonary artery. The recorded end-
diastolic velocity of 1.6 m/s in (A) by modified Bernoulli equation is calculated to be low, indicating low pressures while an end-diastolic
[19]
velocity of 3.3 m/s in (B) indicates increased pulmonary artery pressure. Reproduced from Ref. .
Figure 18. Selected video frames from parasternal short-axis 2D and color Doppler study displaying a patent ductus arteriosus (PDA)
with left-to-right shunt in (A). Pulse Doppler interrogation of the PDA in (B) depicts low velocity (1.0-1.4 m/s) indicating that the
pressure in the pulmonary artery is likely to be high (see the text). Aorta (Ao), descending aorta (DAo), pulmonary artery (PA), and
right ventricle (RV) are labeled. Reproduced from Ref. [20] .
If the Doppler flow velocity across the PDA is low [Figure 18], the pressure in the PA is likely to be elevated.
On the contrary, high Doppler velocity across PDA [Figure 19] suggests that the pressure in the PA is low.
If no Doppler jets could be recorded in the right heart, indirect signs such as enlargement of the right
atrium (RA), dilatation and hypertrophy of the RV, dilatation of the PA, and inter-ventricular septal
flattening may signify elevated pressures in the PA. However, the magnitude of the increase of PA pressure
may not be quantified. In addition, short acceleration time (< 100 ms) of the PA flow velocity curve and
“spike and dome” pattern may also indicate increased PA pressure.
VENTRICULAR FUNCTION
The ventricular systolic function may be assessed by evaluating myocardial mechanics or chamber
mechanics or a combination of the two (hybrid). Left and right ventricular systolic functions will be