
Page 79 - Read Online
P. 79
Page 12 of 23 Rao. Vessel Plus 2022;6:24 https://dx.doi.org/10.20517/2574-1209.2021.91
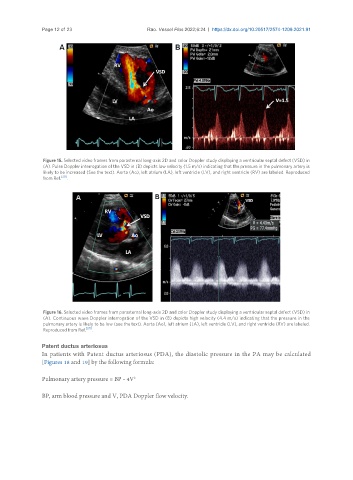
Figure 15. Selected video frames from parasternal long-axis 2D and color Doppler study displaying a ventricular septal defect (VSD) in
(A). Pulse Doppler interrogation of the VSD in (B) depicts low velocity (1.5 m/s) indicating that the pressure in the pulmonary artery is
likely to be increased (See the text). Aorta (Ao), left atrium (LA), left ventricle (LV), and right ventricle (RV) are labeled. Reproduced
from Ref. [20] .
Figure 16. Selected video frames from parasternal long-axis 2D and color Doppler study displaying a ventricular septal defect (VSD) in
(A). Continuous wave Doppler interrogation of the VSD in (B) depicts high velocity (4.4 m/s) indicating that the pressure in the
pulmonary artery is likely to be low (see the text). Aorta (Ao), left atrium (LA), left ventricle (LV), and right ventricle (RV) are labeled.
Reproduced from Ref. [20] .
Patent ductus arteriosus
In patients with Patent ductus arteriosus (PDA), the diastolic pressure in the PA may be calculated
[Figures 18 and 19] by the following formula:
Pulmonary artery pressure = BP - 4V 2
BP, arm blood pressure and V, PDA Doppler flow velocity.