
Page 93 - Read Online
P. 93
Kim et al. Soft Sci 2024;4:33 https://dx.doi.org/10.20517/ss.2024.28 Page 17 of 31
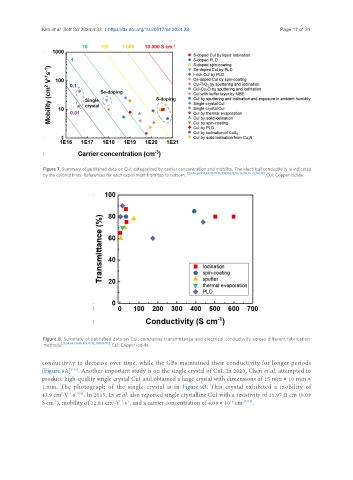
Figure 7. Summary of published data on CuI, categorized by carrier concentration and mobility. The electrical conductivity is indicated
by the colored lines. References for each experiment from top to bottom: [28,46,34,109,38,110,111,112,113,114,32,115,36,116,117,37,118,39] . CuI: Copper iodide.
Figure 8. Summary of published data on CuI, comparing transmittance and electrical conductivity across different fabrication
[28,34,36-39,46,109,111,112,114,116-118]
methods . CuI: Copper iodide.
conductivity to decrease over time, while the GBs maintained their conductivity for longer periods
[119]
[Figure 9A] . Another important study is on the single crystal of CuI. In 2020, Chen et al. attempted to
produce high-quality single crystal CuI and obtained a large crystal with dimensions of 15 mm × 10 mm ×
1 mm. The photograph of the single crystal is in Figure 9B. This crystal exhibited a mobility of
2
-1 -1[32]
43.9 cm ·V ·s . In 2015, Lv et al. also reported single crystalline CuI with a resistivity of 11.97 Ω cm (0.08
S·cm ), mobility of 12.81 cm ·V ·s , and a carrier concentration of 4.08 × 10 cm -3[115] .
-1 -1
16
-1
2