
Page 61 - Read Online
P. 61
Ao et al. Soft Sci 2024;4:3 https://dx.doi.org/10.20517/ss.2023.34 Page 3 of 9
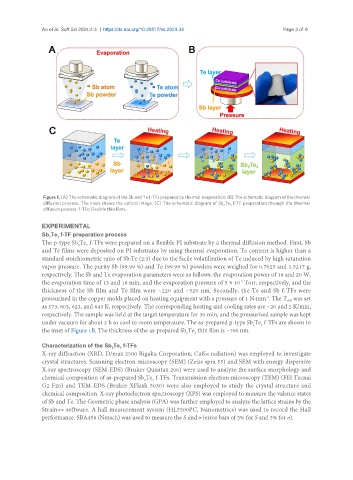
Figure 1. (A) The schematic diagram of the Sb and Te f-TFs prepared by thermal evaporation; (B) The schematic diagram of the thermal
diffusion process. The Inset shows the optical image; (C) The schematic diagram of Sb Te f-TF preparation through the thermal
3
2
diffusion process. f-TFs: Flexible thin films.
EXPERIMENTAL
Sb Te f-TF preparation process
3
2
The p-type Sb Te f-TFs were prepared on a flexible PI substrate by a thermal diffusion method. First, Sb
2
3
and Te films were deposited on PI substrates by using thermal evaporation. Te content is higher than a
standard stoichiometric ratio of Sb:Te (2:3) due to the facile volatilization of Te induced by high saturation
vapor pressure. The purity Sb (99.99 %) and Te (99.99 %) powders were weighed for 0.7025 and 1.5217 g,
respectively. The Sb and Te evaporation parameters were as follows: the evaporation power of 18 and 20 W,
-5
the evaporation time of 13 and 16 min, and the evaporation pressure of 5 × 10 Torr, respectively, and the
thickness of the Sb film and Te film were ~220 and ~520 nm. Secondly, the Te and Sb f-TFs were
pressurized in the copper molds placed on heating equipment with a pressure of 1 N·mm . The T was set
-2
diff
as 573, 603, 623, and 643 K, respectively. The corresponding heating and cooling rates are ~20 and 2 K/min,
respectively. The sample was held at the target temperature for 30 min, and the pressurized sample was kept
under vacuum for about 2 h to cool to room temperature. The as-prepared p-type Sb Te f-TFs are shown in
2
3
the inset of Figure 1B. The thickness of the as-prepared Sb Te thin film is ~700 nm.
3
2
Characterization of the Sb Te f-TFs
3
2
X-ray diffraction (XRD, D/max 2500 Rigaku Corporation, CuKα radiation) was employed to investigate
crystal structures. Scanning electron microscopy (SEM) (Zeiss spra 55) and SEM with energy dispersive
X-ray spectroscopy (SEM-EDS) (Bruker Quantax 200) were used to analyze the surface morphology and
chemical composition of as-prepared Sb Te f-TFs. Transmission electron microscopy (TEM) (FEI Tecnai
2
3
G2 F20) and TEM-EDS (Bruker XFlash 5030) were also employed to study the crystal structure and
chemical composition. X-ray photoelectron spectroscopy (XPS) was employed to measure the valence states
of Sb and Te. The Geometric phase analysis (GPA) was further employed to analyze the lattice strains by the
Strain++ software. A hall measurement system (HL5500PC, Nanometrics) was used to record the Hall
performance. SBA458 (Nezsch) was used to measure the S and σ (error bars of 5% for S and 5% for σ).