
Page 64 - Read Online
P. 64
Page 6 of 9 Ao et al. Soft Sci 2024;4:3 https://dx.doi.org/10.20517/ss.2023.34
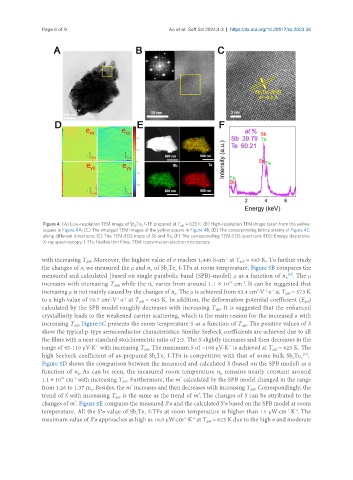
Figure 4. (A) Low-resolution TEM image of Sb Te f-TF prepared at T = 623 K; (B) High-resolution TEM image taken from the yellow
2
diff
3
square in Figure 4A; (C) The enlarged TEM images of the yellow square in Figure 4B; (D) The corresponding lattice strains of Figure 4C
along different directions; (E) The TEM-EDS maps of Sb and Te; (F) The corresponding TEM-EDS spectrum. EDS: Energy dispersive
X-ray spectroscopy; f-TFs: flexible thin films; TEM: transmission electron microscopy.
with increasing T . Moreover, the highest value of σ reaches 1,440 S·cm at T = 643 K. To further study
-1
diff
diff
the changes of σ, we measured the μ and n of Sb Te f-TFs at room temperature. Figure 5B compares the
3
h
2
measured and calculated [based on single parabolic band (SPB)-model] μ as a function of n h [33] . The μ
-3
19
increases with increasing T , while the n varies from around 1.1 × 10 cm . It can be suggested that
diff
h
increasing μ is not mainly caused by the changes of n . The μ is achieved from 63.4 cm ·V ·s at T = 573 K
2
-1 -1
h
diff
to a high value of 79.7 cm ·V ·s at T = 643 K. In addition, the deformation potential coefficient (E )
-1 -1
2
def
diff
calculated by the SPB model roughly decreases with increasing T . It is suggested that the enhanced
diff
crystallinity leads to the weakened carrier scattering, which is the main reason for the increased σ with
increasing T . Figure 5C presents the room temperature S as a function of T . The positive values of S
diff
diff
show the typical p-type semiconductor characteristics. Similar Seebeck coefficients are achieved due to all
the films with a near standard stoichiometric ratio of 2:3. The S slightly increases and then decreases in the
-1
range of 95-110 μV·K with increasing T . The maximum S of ~106 μV·K is achieved at T = 623 K. The
-1
diff
diff
[34]
high Seebeck coefficient of as-prepared Sb Te f-TFs is competitive with that of some bulk Sb Te .
2
3
3
2
Figure 5D shows the comparison between the measured and calculated S (based on the SPB model) as a
function of n . As can be seen, the measured room temperature n remains nearly constant around
h
h
1.1 × 10 cm with increasing T . Furthermore, the m calculated by the SPB model changed in the range
20
*
-3
diff
*
from 1.26 to 1.37 m . Besides, the m increases and then decreases with increasing T . Correspondingly, the
0
diff
trend of S with increasing T is the same as the trend of m . The changes of S can be attributed to the
*
diff
2
changes of m . Figure 5E compares the measured S σ and the calculated S σ based on the SPB model at room
*
2
-2
temperature. All the S σ value of Sb Te f-TFs at room temperature is higher than 11 μW·cm ·K . The
-1
2
2
3
maximum value of S σ approaches as high as 16.0 μW·cm ·K at T = 623 K due to the high σ and moderate
-2
-1
2
diff