
Page 62 - Read Online
P. 62
Page 4 of 9 Ao et al. Soft Sci 2024;4:3 https://dx.doi.org/10.20517/ss.2023.34
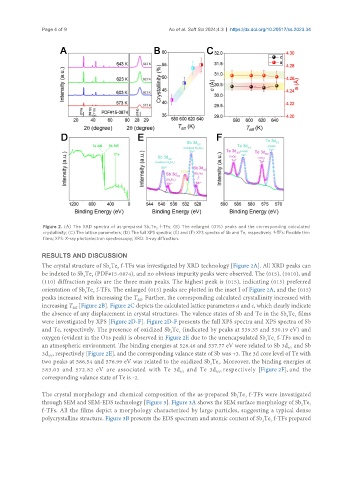
Figure 2. (A) The XRD spectra of as-prepared Sb Te f-TFs; (B) The enlarged (015) peaks and the corresponding calculated
3
2
crystallinity; (C) The lattice parameters; (D) The full XPS spectra; (E) and (F) XPS spectra of Sb and Te, respectively. f-TFs: Flexible thin
films; XPS: X-ray photoelectron spectroscopy; XRD: X-ray diffraction.
RESULTS AND DISCUSSION
The crystal structure of Sb Te f-TFs was investigated by XRD technology [Figure 2A]. All XRD peaks can
2
3
be indexed to Sb Te (PDF#15-0874), and no obvious impurity peaks were observed. The (015), (1010), and
2
3
(110) diffraction peaks are the three main peaks. The highest peak is (015), indicating (015) preferred
orientation of Sb Te f-TFs. The enlarged (015) peaks are plotted in the inset I of Figure 2A, and the (015)
2
3
peaks increased with increasing the T . Further, the corresponding calculated crystallinity increased with
diff
increasing T [Figure 2B]. Figure 2C depicts the calculated lattice parameters a and c, which clearly indicate
diff
the absence of any displacement in crystal structures. The valence states of Sb and Te in the Sb Te films
2
3
were investigated by XPS [Figure 2D-F]. Figure 2D-F presents the full XPS spectra and XPS spectra of Sb
and Te, respectively. The presence of oxidized Sb Te (indicated by peaks at 539.35 and 530.19 eV) and
3
2
oxygen (evident in the O1s peak) is observed in Figure 2E due to the unencapsulated Sb Te f-TFs used in
3
2
an atmospheric environment. The binding energies at 528.46 and 537.77 eV were related to Sb 3d and Sb
5/2
3d , respectively [Figure 2E], and the corresponding valance state of Sb was +3. The 3d core level of Te with
3/2
two peaks at 586.54 and 576.99 eV was related to the oxidized Sb Te . Moreover, the binding energies at
2
3
583.03 and 572.82 eV are associated with Te 3d and Te 3d , respectively [Figure 2F], and the
5/2
3/2
corresponding valance state of Te is -2.
The crystal morphology and chemical composition of the as-prepared Sb Te f-TFs were investigated
2
3
through SEM and SEM-EDS technology [Figure 3]. Figure 3A shows the SEM surface morphology of Sb Te
3
2
f-TFs. All the films depict a morphology characterized by large particles, suggesting a typical dense
polycrystalline structure. Figure 3B presents the EDS spectrum and atomic content of Sb Te f-TFs prepared
2
3