
Page 63 - Read Online
P. 63
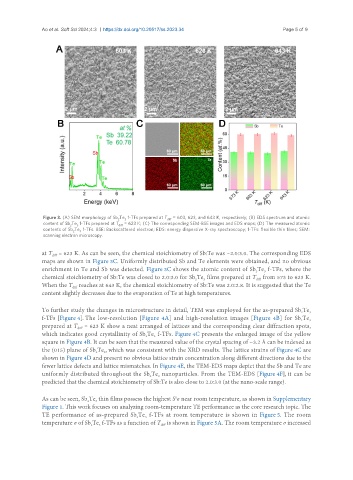
Ao et al. Soft Sci 2024;4:3  https://dx.doi.org/10.20517/ss.2023.34              Page 5 of 9


                Figure 3. (A) SEM morphology of Sb Te  f-TFs prepared at T  = 603, 623, and 643 K, respectively; (B) EDS spectrum and atomic
                                         2
                                           3
                                                         diff
                content of Sb Te  f-TFs prepared at T  = 623 K; (C) The corresponding SEM-BSE images and EDS maps; (D) The measured atomic
                         2
                                         diff
                           3
                contents of Sb Te  f-TFs. BSE: Backscattered electron; EDS: energy dispersive X-ray spectroscopy; f-TFs: flexible thin films; SEM:
                          2
                            3
                scanning electron microscopy.
               at T  = 623 K. As can be seen, the chemical stoichiometry of Sb:Te was ~2.0:3.0. The corresponding EDS
                   diff
               maps are shown in Figure 3C. Uniformly distributed Sb and Te elements were obtained, and no obvious
               enrichment in Te and Sb was detected. Figure 3C shows the atomic content of Sb Te  f-TFs, where the
                                                                                       2
                                                                                          3
               chemical stoichiometry of Sb:Te was closed to 2.0:3.0 for Sb Te  films prepared at T  from 573 to 623 K.
                                                                   2
                                                                      3
                                                                                       diff
               When the T  reaches at 643 K, the chemical stoichiometry of Sb:Te was 2.0:2.8. It is suggested that the Te
                         diff
               content slightly decreases due to the evaporation of Te at high temperatures.
               To further study the changes in microstructure in detail, TEM was employed for the as-prepared Sb Te
                                                                                                       2
                                                                                                         3
               f-TFs [Figure 4]. The low-resolution [Figure 4A] and high-resolution images [Figure 4B] for Sb Te
                                                                                                         3
                                                                                                      2
               prepared at T  = 623 K show a neat arranged of lattices and the corresponding clear diffraction spots,
                           diff
               which indicates good crystallinity of Sb Te  f-TFs. Figure 4C presents the enlarged image of the yellow
                                                     3
                                                  2
               square in Figure 4B. It can be seen that the measured value of the crystal spacing of ~3.2 Å can be indexed as
               the (015) plane of Sb Te , which was consistent with the XRD results. The lattice strains of Figure 4C are
                                 2
                                    3
               shown in Figure 4D and present no obvious lattice strain concentration along different directions due to the
               fewer lattice defects and lattice mismatches. In Figure 4E, the TEM-EDS maps depict that the Sb and Te are
               uniformly distributed throughout the Sb Te  nanoparticles. From the TEM-EDS [Figure 4F], it can be
                                                      3
                                                   2
               predicted that the chemical stoichiometry of Sb:Te is also close to 2.0:3.0 (at the nano-scale range).
               As can be seen, Sb Te  thin films possess the highest S σ near room temperature, as shown in Supplementary
                                                            2
                                 3
                              2
               Figure 1. This work focuses on analyzing room-temperature TE performance as the core research topic. The
               TE performance of as-prepared Sb Te  f-TFs at room temperature is shown in Figure 5. The room
                                               2
                                                  3
               temperature σ of Sb Te  f-TFs as a function of T  is shown in Figure 5A. The room temperature σ increased
                                2
                                  3
                                                       diff