
Page 12 - Read Online
P. 12
Page 10 of 14 Shen et al. Soft Sci 2023;3:20 https://dx.doi.org/10.20517/ss.2023.10
Table 1. Optical and electrochemical data of PBED, P(BED-T), P(BED-TT)
L / L
Molecules E (V) a E (V) b c H / H DFT [eV] c ELE d DFT [eV] λ edge fil. [nm]e E g opt. [eV]f
ELE d
ox
red
PBED -1.18 1.60 -6.10/-4.18 -3.35/-1.72 717 1.73
P(BED-T) -1.23 1.58 -6.08/-4.18 -3.30/-2.06 698 1.77
P(BED-TT) -1.12 1.85 -6.30/-4.35 -3.41/-2.18 685 1.78
a b c ELE ELE
the E and E were observed by the cyclic voltammograms of PBEDs. the H and L represent HOMO and LUMO energy levels measured by
red ox
electrochemical methods, respectively, and energy level were carried out by the equation E HOMO/LUMO = - [E - E (ferrocene) + 4.8], where Eox is
ox
1/2
+ d
the onset oxidation potential of the polymer, and E (ferrocene) is the half peak potential of ferrocene vs Ag/Ag . the H DFT and L DFT represent
1/2
e
HOMO and LUMO energy level measured by DFT calculation. absorption edge λ edge fil. of the conducting polymer films in the UV-Vis absorption
f opt. opt. fil.
spectra. the values of E were calculated based on the formula of E = 1240 / λ .
g g edge
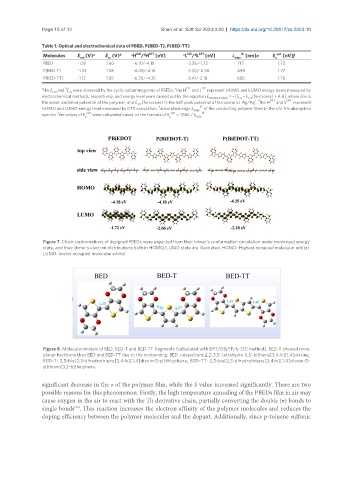
Figure 7. Chain conformations of designed PBEDs were expected from their trimer’s conformation calculation under minimized energy
state, and their dimer’s electron distributions both in HOMO/LUMO state are illustrated. HOMO: Highest occupied molecular orbital;
LUMO: lowest occupied molecular orbital.
Figure 8. Molecular models of BED, BED-T and BED-TT fragments (calculated with DFT/B3LYP/6-31G method). BED-T showed more
planar backbone than BED and BED-TT due to the nonbonding. BED: interactions.2,2',3,3'-tetrahydro-5,5'-bithieno[3,4-b][1,4]dioxine;
BED-T: 2,5-bis(2,3-dihydrothieno[3,4-b][1,4]dioxin-5-yl)thiophene; BED-TT: 2,5-bis(2,3-dihydrothieno[3,4-b][1,4]dioxin-5-
yl)thieno[3,2-b]thiophene.
significant decrease in the σ of the polymer film, while the S value increased significantly. There are two
possible reasons for this phenomenon. Firstly, the high temperature annealing of the PBEDs film in air may
cause oxygen in the air to react with the Th derivative chain, partially converting the double (π) bonds to
[55]
single bonds . This reaction increases the electron affinity of the polymer molecules and reduces the
doping efficiency between the polymer molecules and the dopant. Additionally, since p-toluene sulfonic