
Page 7 - Read Online
P. 7
Shen et al. Soft Sci 2023;3:20 https://dx.doi.org/10.20517/ss.2023.10 Page 5 of 14
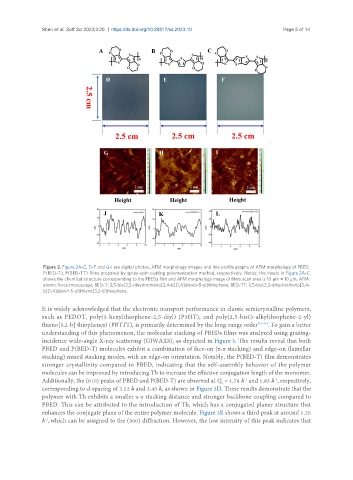
Figure 2. Figure 2A-C, D-F and G-I are digital photos, AFM morphology images and line profile graphs of AFM morphology of PBED,
P(BED-T), P(BED-TT) films prepared by spray-spin coating polymerization method, respectively. Notes: the insets in Figure 2A-C
shows the chemical structure corresponding to the PBEDs film and AFM morphology image of films scan area is 10 μm × 10 μm. AFM:
atomic force microscopy; BED-T: 2,5-bis(2,3-dihydrothieno[3,4-b][1,4]dioxin-5-yl)thiophene; BED-TT: 2,5-bis(2,3-dihydrothieno[3,4-
b][1,4]dioxin-5-yl)thieno[3,2-b]thiophene.
It is widely acknowledged that the electronic transport performance in classic semicrystalline polymers,
such as PEDOT, poly(3-hexylthiophene-2,5-diyl) (P3HT), and poly(2,5-bis(3-alkylthiophene-2-yl)
thieno[3,2-b] thiophenes) (PBTTT), is primarily determined by the long-range order [41-44] . To gain a better
understanding of this phenomenon, the molecular stacking of PBEDs films was analyzed using grazing-
incidence wide-angle X-ray scattering (GIWAXS), as depicted in Figure 3. The results reveal that both
PBED and P(BED-T) molecules exhibit a combination of face-on (π-π stacking) and edge-on (lamellar
stacking) mixed stacking modes, with an edge-on orientation. Notably, the P(BED-T) film demonstrates
stronger crystallinity compared to PBED, indicating that the self-assembly behavior of the polymer
molecules can be improved by introducing Th to increase the effective conjugation length of the monomer.
Additionally, the (010) peaks of PBED and P(BED-T) are observed at Q = 1.78 Å and 1.83 Å , respectively,
-1
-1
z
corresponding to d-spacing of 3.52 Å and 3.43 Å, as shown in Figure 3D. These results demonstrate that the
polymer with Th exhibits a smaller π-π stacking distance and stronger backbone coupling compared to
PBED. This can be attributed to the introduction of Th, which has a conjugated planar structure that
enhances the conjugate plane of the entire polymer molecule. Figure 3E shows a third peak at around 1.25
Å , which can be assigned to the (300) diffraction. However, the low intensity of this peak indicates that
-1