
Page 168 - Read Online
P. 168
Page 16 of 33 Arab Hassani. Soft Sci 2023;3:31 https://dx.doi.org/10.20517/ss.2023.23
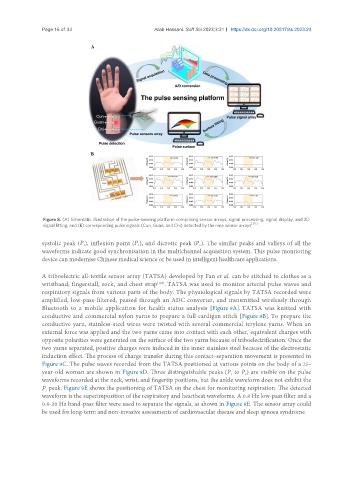
Figure 8. (A) Schematic illustration of the pulse-sensing platform comprising sensor arrays, signal processing, signal display, and 3D
signal fitting; and (B) corresponding pulse signals (Cun, Guan, and Chi) detected by the nine sensor arrays [121] .
P
P
P
systolic peak ( ), inflexion point ( ), and dicrotic peak ( ). The similar peaks and valleys of all the
2
1
3
waveforms indicate good synchronisation in the multichannel acquisition system. This pulse monitoring
device can modernise Chinese medical science or be used in intelligent healthcare applications.
A triboelectric all-textile sensor array (TATSA) developed by Fan et al. can be stitched to clothes as a
wristband, fingerstall, sock, and chest strap . TATSA was used to monitor arterial pulse waves and
[122]
respiratory signals from various parts of the body. The physiological signals by TATSA recorded were
amplified, low-pass-filtered, passed through an ADC converter, and transmitted wirelessly through
Bluetooth to a mobile application for health status analysis [Figure 9A]. TATSA was knitted with
conductive and commercial nylon yarns to prepare a full cardigan stitch [Figure 9B]. To prepare the
conductive yarn, stainless-steel wires were twisted with several commercial terylene yarns. When an
external force was applied and the two yarns came into contact with each other, equivalent charges with
opposite polarities were generated on the surface of the two yarns because of triboelectrification. Once the
two yarns separated, positive charges were induced in the inner stainless steel because of the electrostatic
induction effect. The process of charge transfer during this contact–separation movement is presented in
Figure 9C. The pulse waves recorded from the TATSA positioned at various points on the body of a 25-
P to P ) are visible on the pulse
year-old woman are shown in Figure 9D. Three distinguishable peaks (P to P ) are visible on the pulse
1 1
3 3
waveforms recorded at the neck, wrist, and fingertip positions, but the ankle waveform does not exhibit the
P 2 peak. Figure 9E shows the positioning of TATSA on the chest for monitoring respiration. The detected
waveform is the superimposition of the respiratory and heartbeat waveforms. A 0.8 Hz low-pass filter and a
0.8-20 Hz band-pass filter were used to separate the signals, as shown in Figure 9E. The sensor array could
be used for long-term and non-invasive assessments of cardiovascular disease and sleep apnoea syndrome.