
Page 167 - Read Online
P. 167
Arab Hassani. Soft Sci 2023;3:31 https://dx.doi.org/10.20517/ss.2023.23 Page 15 of 33
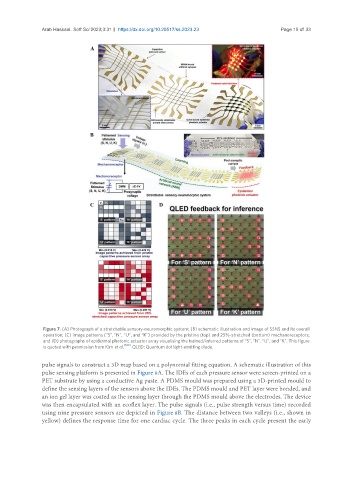
Figure 7. (A) Photograph of a stretchable sensory-neuromorphic system; (B) schematic illustration and image of SSNS and its overall
operation; (C) image patterns (“S”, “N”, “U”, and “K”) provided by the pristine (top) and 25%-stretched (bottom) mechanoreceptors;
and (D) photographs of epidermal photonic actuator array visualising the trained/inferred patterns of “S”, “N”, “U”, and “K”. This figure
[120]
is quoted with permission from Kim et al. . QLED: Quantum dot light-emitting diode.
pulse signals to construct a 3D map based on a polynomial fitting equation. A schematic illustration of this
pulse sensing platform is presented in Figure 8A. The IDEs of each pressure sensor were screen-printed on a
PET substrate by using a conductive Ag paste. A PDMS mould was prepared using a 3D-printed mould to
define the sensing layers of the sensors above the IDEs. The PDMS mould and PET layer were bonded, and
an ion gel layer was coated as the sensing layer through the PDMS mould above the electrodes. The device
was then encapsulated with an ecoflex layer. The pulse signals (i.e., pulse strength versus time) recorded
using nine pressure sensors are depicted in Figure 8B. The distance between two valleys (i.e., shown in
yellow) defines the response time for one cardiac cycle. The three peaks in each cycle present the early