
Page 556 - Read Online
P. 556
Page 10 of 16 Tanikawa Plast Aesthet Res 2020;7:48 I http://dx.doi.org/10.20517/2347-9264.2020.136
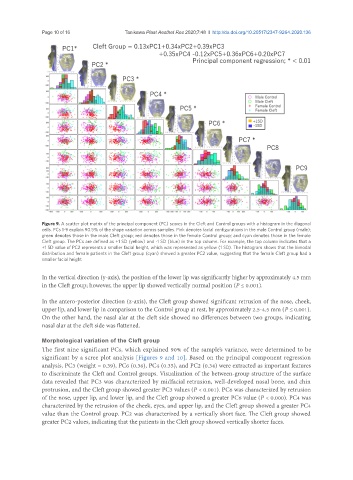
Figure 9. A scatter plot matrix of the principal component (PC) scores in the Cleft and Control groups with a histogram in the diagonal
cells. PCs 1-9 explain 90.5% of the shape variation across samples. Pink denotes facial configurations in the male Control group (male);
green denotes those in the male Cleft group; red denotes those in the female Control group; and cyan denotes those in the female
Cleft group. The PCs are defined as +1 SD (yellow) and -1 SD (blue) in the top column. For example, the top column indicates that a
+1 SD value of PC2 represents a smaller facial height, which was represented as yellow (1 SD). The histogram shows that the bimodal
distribution and female patients in the Cleft group (cyan) showed a greater PC2 value, suggesting that the female Cleft group had a
smaller facial height
In the vertical direction (y-axis), the position of the lower lip was significantly higher by approximately 4.5 mm
in the Cleft group; however, the upper lip showed vertically normal position (P ≤ 0.001).
In the antero-posterior direction (z-axis), the Cleft group showed significant retrusion of the nose, cheek,
upper lip, and lower lip in comparison to the Control group at rest, by approximately 2.5-4.5 mm (P ≤ 0.001).
On the other hand, the nasal alar at the cleft side showed no differences between two groups, indicating
nasal alar at the cleft side was flattened.
Morphological variation of the Cleft group
The first nine significant PCs, which explained 90% of the sample’s variance, were determined to be
significant by a scree plot analysis [Figures 9 and 10]. Based on the principal component regression
analysis, PC3 (weight = 0.39), PC6 (0.36), PC4 (0.35), and PC2 (0.34) were extracted as important features
to discriminate the Cleft and Control groups. Visualization of the between-group structure of the surface
data revealed that PC3 was characterized by midfacial retrusion, well-developed nasal bone, and chin
protrusion, and the Cleft group showed greater PC3 values (P < 0.001). PC6 was characterized by retrusion
of the nose, upper lip, and lower lip, and the Cleft group showed a greater PC6 value (P < 0.000). PC4 was
characterized by the retrusion of the cheek, eyes, and upper lip, and the Cleft group showed a greater PC4
value than the Control group. PC2 was characterized by a vertically short face. The Cleft group showed
greater PC2 values, indicating that the patients in the Cleft group showed vertically shorter faces.