
Page 557 - Read Online
P. 557
Tanikawa Plast Aesthet Res 2020;7:48 I http://dx.doi.org/10.20517/2347-9264.2020.136 Page 11 of 16
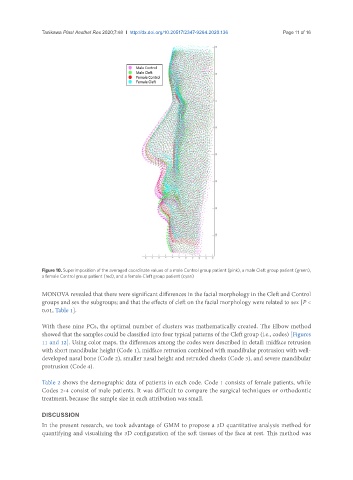
Figure 10. Superimposition of the averaged coordinate values of a male Control group patient (pink), a male Cleft group patient (green),
a female Control group patient (red), and a female Cleft group patient (cyan)
MONOVA revealed that there were significant differences in the facial morphology in the Cleft and Control
groups and sex the subgroups; and that the effects of cleft on the facial morphology were related to sex [P <
0.01, Table 1].
With these nine PCs, the optimal number of clusters was mathematically created. The Elbow method
showed that the samples could be classified into four typical patterns of the Cleft group (i.e., codes) [Figures
11 and 12]. Using color maps, the differences among the codes were described in detail: midface retrusion
with short mandibular height (Code 1), midface retrusion combined with mandibular protrusion with well-
developed nasal bone (Code 2), smaller nasal height and retruded cheeks (Code 3), and severe mandibular
protrusion (Code 4).
Table 2 shows the demographic data of patients in each code. Code 1 consists of female patients, while
Codes 2-4 consist of male patients. It was difficult to compare the surgical techniques or orthodontic
treatment, because the sample size in each attribution was small.
DISCUSSION
In the present research, we took advantage of GMM to propose a 3D quantitative analysis method for
quantifying and visualizing the 3D configuration of the soft tissues of the face at rest. This method was