
Page 558 - Read Online
P. 558
Page 12 of 16 Tanikawa Plast Aesthet Res 2020;7:48 I http://dx.doi.org/10.20517/2347-9264.2020.136
Table 1. The multifactor analysis of variance of the surface-based model
Df Pillai Approx F Num Df Den Df Pr(> F)
Cleft 1 0.8149 108.756 10 247 < 2.2e-16*
Sex 1 0.6727 50.761 10 247 < 2.2e-16*
Cleft: Sex 1 0.1969 6.056 10 247 < 3.13e-8*
Residuals 256
*P < 0.01. Df: degrees of freedom; Pillai: Pillai’s trace, which is a test statistic in the multifactor analysis of variance. This is a positive
valued statistic ranging from 0 to 1. Increasing values means that effects are contributing more to the model; Approx F: the F statistic
for the given predictor and test statistic; Num DF: the number of degrees of freedom in the model; Den Df: the number of degrees of
freedom associated with the model errors; Pr(> F): the P-value associated with the F statistic of a given effect and test statistic. The null
hypothesis that a given predictor has no effect on either of the outcomes is evaluated with regard to this P-value
n n n n
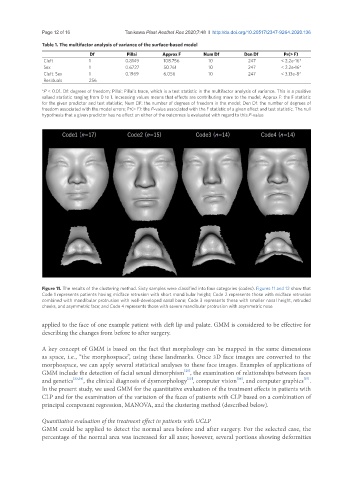
Figure 11. The results of the clustering method. Sixty samples were classified into four categories (codes). Figures 11 and 12 show that
Code 1 represents patients having midface retrusion with short mandibular height; Code 2 represents those with midface retrusion
combined with mandibular protrusion with well-developed nasal bone; Code 3 represents those with smaller nasal height, retruded
cheeks, and asymmetric face; and Code 4 represents those with severe mandibular protrusion with asymmetric nose
applied to the face of one example patient with cleft lip and palate. GMM is considered to be effective for
describing the changes from before to after surgery.
A key concept of GMM is based on the fact that morphology can be mapped in the same dimensions
as space, i.e., “the morphospace”, using these landmarks. Once 3D face images are converted to the
morphospace, we can apply several statistical analyses to these face images. Examples of applications of
[21]
GMM include the detection of facial sexual dimorphism , the examination of relationships between faces
and genetics [23,24] , the clinical diagnosis of dysmorphology , computer vision , and computer graphics .
[25]
[27]
[26]
In the present study, we used GMM for the quantitative evaluation of the treatment effects in patients with
CLP and for the examination of the variation of the faces of patients with CLP based on a combination of
principal component regression, MANOVA, and the clustering method (described below).
Quantitative evaluation of the treatment effect in patients with UCLP
GMM could be applied to detect the normal area before and after surgery. For the selected case, the
percentage of the normal area was increased for all axes; however, several portions showing deformities