
Page 554 - Read Online
P. 554
Page 8 of 16 Tanikawa Plast Aesthet Res 2020;7:48 I http://dx.doi.org/10.20517/2347-9264.2020.136
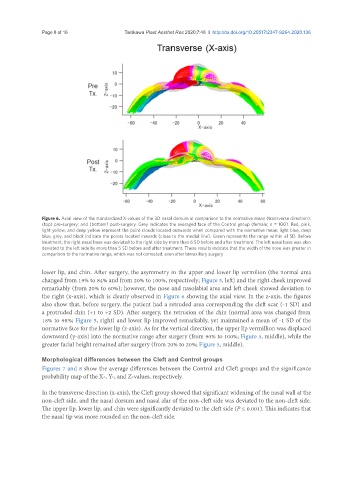
Figure 6. Axial view of the standardized X-values of the 3D nasal dorsum in comparison to the normative mean (transverse direction):
(top) pre-surgery; and (bottom) post-surgery. Grey indicates the averaged face of the Control group (female; n = 100). Red, pink,
light yellow, and deep yellow represent the point clouds located outwards when compared with the normative mean; light blue, deep
blue, grey, and black indicate the points located inwards (close to the medial line). Green represents the range within ±1 SD. Before
treatment, the right nasal base was deviated to the right side by more than 6 SD before and after treatment. The left nasal base was also
deviated to the left side by more than 5 SD before and after treatment. These results indicate that the width of the nose was greater in
comparison to the normative range, which was not corrected, even after bimaxillary surgery
lower lip, and chin. After surgery, the asymmetry in the upper and lower lip vermilion (the normal area
changed from 19% to 84% and from 20% to 100%, respectively; Figure 5, left) and the right cheek improved
remarkably (from 20% to 60%); however, the nose and nasolabial area and left cheek showed deviation to
the right (x-axis), which is clearly observed in Figure 6 showing the axial view. In the z-axis, the figures
also show that, before surgery, the patient had a retruded area corresponding the cleft scar (-1 SD) and
a protruded chin (+1 to +2 SD). After surgery, the retrusion of the chin (normal area was changed from
18% to 98%; Figure 5, right) and lower lip improved remarkably, yet maintained a mean of -1 SD of the
normative face for the lower lip (z-axis). As for the vertical direction, the upper lip vermillion was displaced
downward (y-axis) into the normative range after surgery (from 90% to 100%; Figure 5, middle), while the
greater facial height remained after surgery (from 20% to 20%; Figure 5, middle).
Morphological differences between the Cleft and Control groups
Figures 7 and 8 show the average differences between the Control and Cleft groups and the significance
probability map of the X-, Y-, and Z-values, respectively.
In the transverse direction (x-axis), the Cleft group showed that significant widening of the nasal wall at the
non-cleft side, and the nasal dorsum and nasal alar of the non-cleft side was deviated to the non-cleft side.
The upper lip, lower lip, and chin were significantly deviated to the cleft side (P ≤ 0.001). This indicates that
the nasal tip was more rounded on the non-cleft side.