
Page 551 - Read Online
P. 551
Tanikawa Plast Aesthet Res 2020;7:48 I http://dx.doi.org/10.20517/2347-9264.2020.136 Page 5 of 16
A B C
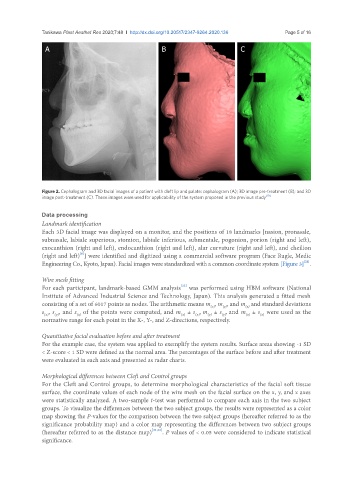
Figure 2. Cephalogram and 3D facial images of a patient with cleft lip and palate: cephalogram (A); 3D image pre-treatment (B); and 3D
image post-treatment (C). These images were used for applicability of the system proposed in the previous study [19]
Data processing
Landmark identification
Each 3D facial image was displayed on a monitor, and the positions of 18 landmarks [nasion, pronasale,
subnasale, labiale superious, stomion, labiale inferious, submentale, pogonion, porion (right and left),
exocanthion (right and left), endocanthion (right and left), alar curvature (right and left), and cheilion
[8]
(right and left) ] were identified and digitized using a commercial software program (Face Rugle, Medic
[21]
Engineering Co., Kyoto, Japan). Facial images were standardized with a common coordinate system [Figure 3] .
Wire mesh fitting
[22]
For each participant, landmark-based GMM analysis was performed using HBM software (National
Institute of Advanced Industrial Science and Technology, Japan). This analysis generated a fitted mesh
consisting of a set of 6017 points as nodes. The arithmetic means m , m , and m and standard deviations
(y)
(z)
(x)
s , s , and s of the points were computed, and m ± s , m ± s , and m ± s were used as the
(x)
(y)
(z)
(y)
(z)
(y)
(z)
(x)
(x)
normative range for each point in the X-, Y-, and Z-directions, respectively.
Quantitative facial evaluation before and after treatment
For the example case, the system was applied to exemplify the system results. Surface areas showing -1 SD
< Z-score < 1 SD were defined as the normal area. The percentages of the surface before and after treatment
were evaluated in each axis and presented as radar charts.
Morphological differences between Cleft and Control groups
For the Cleft and Control groups, to determine morphological characteristics of the facial soft tissue
surface, the coordinate values of each node of the wire mesh on the facial surface on the x, y, and z axes
were statistically analyzed. A two-sample t-test was performed to compare each axis in the two subject
groups. To visualize the differences between the two subject groups, the results were represented as a color
map showing the P-values for the comparison between the two subject groups (hereafter referred to as the
significance probability map) and a color map representing the differences between two subject groups
(hereafter referred to as the distance map) [21,22] . P values of < 0.05 were considered to indicate statistical
significance.