
Page 552 - Read Online
P. 552
Page 6 of 16 Tanikawa Plast Aesthet Res 2020;7:48 I http://dx.doi.org/10.20517/2347-9264.2020.136
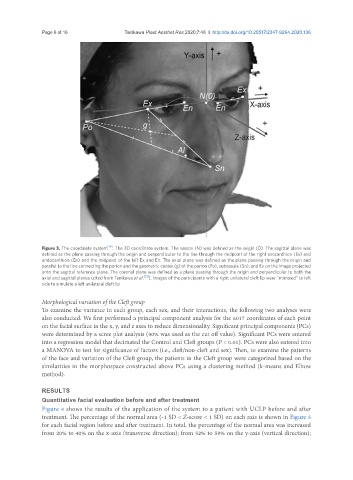
Figure 3. The coordinate system [19] . The 3D coordinate system. The nasion (N) was defined as the origin (O). The sagittal plane was
defined as the plane passing through the origin and perpendicular to the line through the midpoint of the right exocanthion (Ex) and
endocanthion (En) and the midpoint of the left Ex and En. The axial plane was defined as the plane passing through the origin and
parallel to the line connecting the porion and the geometric center (g) of the porion (Po), subnasale (Sn), and Ex on the image projected
onto the sagittal reference plane. The coronal plane was defined as a plane passing through the origin and perpendicular to both the
axial and sagittal planes (cited from Tanikawa et al. [21] ). Images of the participants with a right unilateral cleft lip were “mirrored” to left
side to simulate a left unilateral cleft lip
Morphological variation of the Cleft group
To examine the variance in each group, each sex, and their interactions, the following two analyses were
also conducted. We first performed a principal component analysis for the 6017 coordinates of each point
on the facial surface in the x, y, and z axes to reduce dimensionality. Significant principal components (PCs)
were determined by a scree plot analysis (90% was used as the cut off value). Significant PCs were entered
into a regression model that decimated the Control and Cleft groups (P < 0.01). PCs were also entered into
a MANOVA to test for significance of factors (i.e., cleft/non-cleft and sex). Then, to examine the patterns
of the face and variation of the Cleft group, the patients in the Cleft group were categorized based on the
similarities in the morphospace constructed above PCs using a clustering method (k-means and Elbow
method).
RESULTS
Quantitative facial evaluation before and after treatment
Figure 4 shows the results of the application of the system to a patient with UCLP before and after
treatment. The percentage of the normal area (-1 SD < Z-score < 1 SD) on each axis is shown in Figure 5
for each facial region before and after treatment. In total, the percentage of the normal area was increased
from 20% to 40% on the x-axis (transverse direction); from 52% to 59% on the y-axis (vertical direction);