
Page 555 - Read Online
P. 555
Tanikawa Plast Aesthet Res 2020;7:48 I http://dx.doi.org/10.20517/2347-9264.2020.136 Page 9 of 16
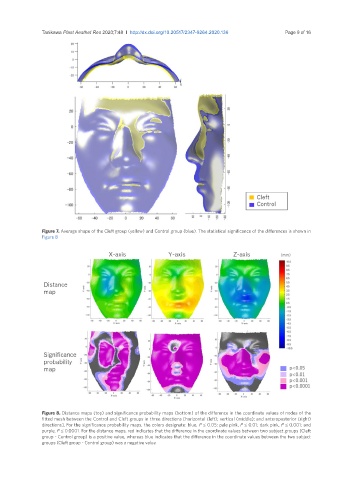
Figure 7. Average shape of the Cleft group (yellow) and Control group (blue). The statistical significance of the differences is shown in
Figure 8
Figure 8. Distance maps (top) and significance probability maps (bottom) of the difference in the coordinate values of nodes of the
fitted mesh between the Control and Cleft groups in three directions [horizontal (left); vertical (middle); and anteroposterior (right)
directions]. For the significance probability maps, the colors designate: blue, P ≤ 0.05; pale pink, P ≤ 0.01; dark pink, P ≤ 0.001; and
purple, P ≤ 0.0001. For the distance maps, red indicates that the difference in the coordinate values between two subject groups (Cleft
group - Control group) is a positive value, whereas blue indicates that the difference in the coordinate values between the two subject
groups (Cleft group - Control group) was a negative value