
Page 559 - Read Online
P. 559
Tanikawa Plast Aesthet Res 2020;7:48 I http://dx.doi.org/10.20517/2347-9264.2020.136 Page 13 of 16
n n n n
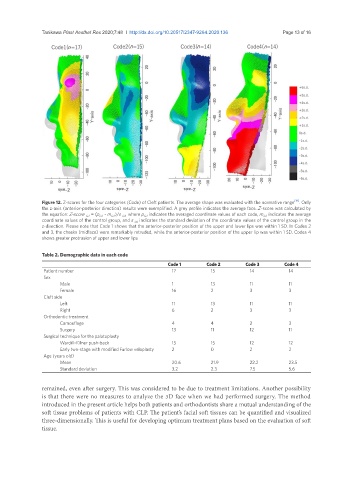
Figure 12. Z-scores for the four categories (Code) of Cleft patients. The average shape was evaluated with the normative range [19] . Only
the z-axis (anterior-posterior direction) results were exemplified. A grey profile indicates the average face. Z-score was calculated by
the equation: Z-score (z) = (p (z) - m (z) )/s (z) , where p (z) indicates the averaged coordinate values of each code, m (z) indicates the average
coordinate values of the control group, and s (z) indicates the standard deviation of the coordinate values of the control group in the
z-direction. Please note that Code 1 shows that the anterior-posterior position of the upper and lower lips was within 1 SD. In Codes 2
and 3, the cheeks (midface) were remarkably retruded, while the anterior-posterior position of the upper lip was within 1 SD. Codes 4
shows greater protrusion of upper and lower lips
Table 2. Demographic data in each code
Code 1 Code 2 Code 3 Code 4
Patient number 17 15 14 14
Sex
Male 1 13 11 11
Female 16 2 3 3
Cleft side
Left 11 13 11 11
Right 6 2 3 3
Orthodontic treatment
Camouflage 4 4 2 3
Surgery 13 11 12 11
Surgical technique for the palatoplasty
Wardill-Kilner push-back 15 15 12 12
Early two-stage with modified Furlow veloplasty 2 0 2 2
Age (years old)
Mean 20.6 21.9 22.2 23.5
Standard deviation 3.2 2.3 7.5 5.6
remained, even after surgery. This was considered to be due to treatment limitations. Another possibility
is that there were no measures to analyze the 3D face when we had performed surgery. The method
introduced in the present article helps both patients and orthodontists share a mutual understanding of the
soft tissue problems of patients with CLP. The patient’s facial soft tissues can be quantified and visualized
three-dimensionally. This is useful for developing optimum treatment plans based on the evaluation of soft
tissue.