
Page 326 - Read Online
P. 326
Liu et al. Adipogenesis of obital fat stem cells
A B
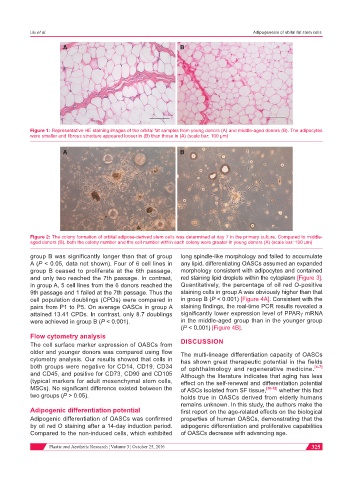
Figure 1: Representative HE staining images of the orbital fat samples from young donors (A) and middle-aged donors (B). The adipocytes
were smaller and fibrous structure appeared looser in (B) than those in (A) (scale bar: 100 µm)
A B
Figure 2: The colony formation of orbital adipose-derived stem cells was determined at day 7 in the primary culture. Compared to middle-
aged donors (B), both the colony number and the cell number within each colony were greater in young donors (A) (scale bar: 100 µm)
group B was significantly longer than that of group long spindle-like morphology and failed to accumulate
A (P < 0.05, data not shown). Four of 6 cell lines in any lipid, differentiating OASCs assumed an expanded
group B ceased to proliferate at the 6th passage, morphology consistent with adipocytes and contained
and only two reached the 7th passage. In contrast, red staining lipid droplets within the cytoplasm [Figure 3].
in group A, 5 cell lines from the 6 donors reached the Quantitatively, the percentage of oil red O-positive
9th passage and 1 failed at the 7th passage. Thus the staining cells in group A was obviously higher than that
cell population doublings (CPDs) were compared in in group B (P < 0.001) [Figure 4A]. Consistent with the
pairs from P1 to P5. On average OASCs in group A staining findings, the real-time PCR results revealed a
attained 13.41 CPDs. In contrast, only 8.7 doublings significantly lower expression level of PPARγ mRNA
were achieved in group B (P < 0.001). in the middle-aged group than in the younger group
(P < 0.001) [Figure 4B].
Flow cytometry analysis
The cell surface marker expression of OASCs from DISCUSSION
older and younger donors was compared using flow The multi-lineage differentiation capacity of OASCs
cytometry analysis. Our results showed that cells in has shown great therapeutic potential in the fields
both groups were negative for CD14, CD19, CD34 of ophthalmology and regenerative medicine. [4-7]
and CD45, and positive for CD73, CD90 and CD105 Although the literature indicates that aging has less
(typical markers for adult mesenchymal stem cells, effect on the self-renewal and differentiation potential
MSCs). No significant difference existed between the of ASCs isolated from SF tissue, [10-12] whether this fact
two groups (P > 0.05). holds true in OASCs derived from elderly humans
remains unknown. In this study, the authors make the
Adipogenic differentiation potential first report on the age-related effects on the biological
Adipogenic differentiation of OASCs was confirmed properties of human OASCs, demonstrating that the
by oil red O staining after a 14-day induction period. adipogenic differentiation and proliferative capabilities
Compared to the non-induced cells, which exhibited of OASCs decrease with advancing age.
Plastic and Aesthetic Research ¦ Volume 3 ¦ October 25, 2016 325