
Page 227 - Read Online
P. 227
Figueroa-Hall et al. TLR4-mediated signaling in CHME-5 cells
A 3
TLR4 mRNA relative expression 2 1
0
US 3 6 18 h
LPS (μg/mL)
C 3
B LPS (1 μg/mL)
Ladder US 10 30 90 180 270 min 2
kDa: 95 TLR4 TLR4/β-tubulin
52 β-tubulin 1
0
US 10 30 90 180 270
Minutes
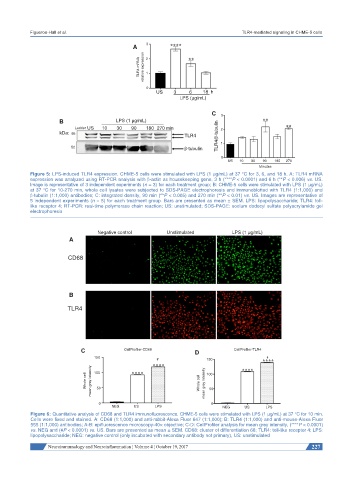
Figure 5: LPS-induced TLR4 expression. CHME-5 cells were stimulated with LPS (1 μg/mL) at 37 °C for 3, 6, and 18 h. A: TLR4 mRNA
expression was analyzed using RT-PCR analysis with β-actin as housekeeping gene, 3 h (****P < 0.0001) and 6 h (**P < 0.006) vs. US.
Image is representative of 3 independent experiments (n = 3) for each treatment group; B: CHME-5 cells were stimulated with LPS (1 μg/mL)
at 37 °C for 10-270 min, whole cell lysates were subjected to SDS-PAGE electrophoresis and immunoblotted with TLR4 (1:1,000) and
β-tubulin (1:1,000) antibodies; C: integrated density, 90 min (**P < 0.005) and 270 min (**P < 0.01) vs. US. Images are representative of
5 independent experiments (n = 5) for each treatment group. Bars are presented as mean ± SEM. LPS: lipopolysaccharide; TLR4: toll-
like receptor 4; RT-PCR: real-time polymerase chain reaction; US: unstimulated; SDS-PAGE: sodium dodecyl sulfate polyacrylamide gel
electrophoresis
Negative control Unstimulated LPS (1 μg/mL)
A
CD68
B
TLR4
C CellProfiler-CD68 D CellProfiler-TLR4
150 # 150 #
Whole cell mean grey intensity 100 Whole cell mean grey intensity 100
50
50
0 0
NEG US LPS NEG US LPS
Figure 6: Quantitative analysis of CD68 and TLR4 immunofluorescence. CHME-5 cells were stimulated with LPS (1 μg/mL) at 37 °C for 10 min.
Cells were fixed and stained. A: CD68 (1:1,000) and anti-rabbit-Alexa Fluor 647 (1:1,000); B: TLR4 (1:1,000) and anti-mouse-Alexa Fluor
555 (1:1,000) antibodies; A-B: epifluorescence microscopy-40× objective; C-D: CellProfiler analysis for mean grey intensity, (****P < 0.0001)
vs. NEG and (#P < 0.0001) vs. US. Bars are presented as mean ± SEM. CD68: cluster of differentiation 68; TLR4: toll-like receptor 4; LPS:
lipopolysaccharide; NEG: negative control (only incubated with secondary antibody not primary), US: unstimulated
Neuroimmunology and Neuroinflammation ¦ Volume 4 ¦ October 19, 2017 227