
Page 224 - Read Online
P. 224
Figueroa-Hall et al. TLR4-mediated signaling in CHME-5 cells
A B
LPS (μg/mL) 4
p-NF-κB p65/NF-κB p65 Fold Change
ladder US 0.1 1
kDa: 72 3
NF-κB p-p65
72 2
NF-κB p65
52 β-tubulin 1
0
0.1 1
LPS (μg/mL)
C 1.5 D
800,000
Cell Viability Absorbance (492 nm) 1.0 NF-κB p65 binding activity/mg protein 1,000,000
600,000
0.5
400,000
0.0 200,000
US 0.001 0.01 0.1 1 10
US 10 30 90 180 270
LPS O55:B5 (μg/mL)
Minutes
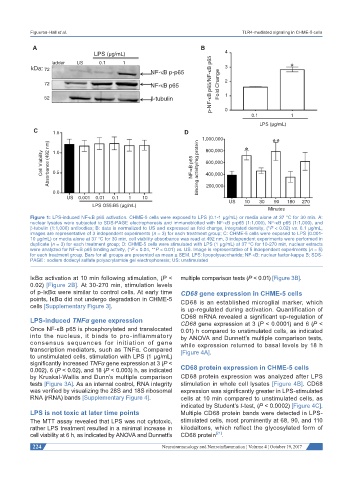
Figure 1: LPS-induced NF-κB p65 activation. CHME-5 cells were exposed to LPS (0.1-1 μg/mL) or media alone at 37 °C for 30 min. A:
nuclear lysates were subjected to SDS-PAGE electrophoresis and immunoblotted with NF-κB p-p65 (1:1,000), NF-κB p65 (1:1,000), and
β-tubulin (1:1,000) antibodies; B: data is normalized to US and expressed as fold change, integrated density, (*P < 0.02) vs. 0.1 μg/mL,
images are representative of 3 independent experiments (n = 3) for each treatment group; C: CHME-5 cells were exposed to LPS (0.001-
10 μg/mL) or media alone at 37 °C for 30 min, cell viability absorbance was read at 492 nm, 3 independent experiments were performed in
duplicate (n = 3) for each treatment group; D: CHME-5 cells were stimulated with LPS (1 μg/mL) at 37 °C for 10-270 min, nuclear extracts
were analyzed for NF-κB p65 binding activity, (*P < 0.04, **P < 0.01) vs. US. Image is representative of 5 independent experiments (n = 5)
for each treatment group. Bars for all groups are presented as mean ± SEM. LPS: lipopolysaccharide; NF-κB: nuclear factor-kappa B; SDS-
PAGE: sodium dodecyl sulfate polyacrylamide gel electrophoresis; US: unstimulated
IκBα activation at 10 min following stimulation, (P < multiple comparison tests (P < 0.01) [Figure 3B].
0.02) [Figure 2B]. At 30-270 min, stimulation levels
of p-IκBα were similar to control cells. At early time CD68 gene expression in CHME-5 cells
points, IκBα did not undergo degradation in CHME-5 CD68 is an established microglial marker, which
cells [Supplementary Figure 3]. is up-regulated during activation. Quantification of
CD68 mRNA revealed a significant up-regulation of
LPS-induced TNFα gene expression CD68 gene expression at 3 (P < 0.0001) and 6 (P <
Once NF-κB p65 is phosphorylated and translocated 0.01) h compared to unstimulated cells, as indicated
into the nucleus, it binds to pro-inflammatory by ANOVA and Dunnett’s multiple comparison tests,
consensus sequences for initiation of gene while expression returned to basal levels by 18 h
transcription mediators, such as TNFα. Compared [Figure 4A].
to unstimulated cells, stimulation with LPS (1 μg/mL)
significantly increased TNFα gene expression at 3 (P <
0.002), 6 (P < 0.02), and 18 (P < 0.003) h, as indicated CD68 protein expression in CHME-5 cells
by Kruskal-Wallis and Dunn’s multiple comparison CD68 protein expression was analyzed after LPS
tests [Figure 3A]. As an internal control, RNA integrity stimulation in whole cell lysates [Figure 4B]. CD68
was verified by visualizing the 28S and 18S ribosomal expression was significantly greater in LPS-stimulated
RNA (rRNA) bands [Supplementary Figure 4]. cells at 10 min compared to unstimulated cells, as
indicated by Student’s t-test, (P < 0.0002) [Figure 4C].
LPS is not toxic at later time points Multiple CD68 protein bands were detected in LPS-
The MTT assay revealed that LPS was not cytotoxic, stimulated cells, most prominently at 68, 90, and 110
rather LPS treatment resulted in a minimal increase in kilodaltons, which reflect the glycosylated form of
cell viability at 6 h, as indicated by ANOVA and Dunnett’s CD68 protein .
[21]
224 Neuroimmunology and Neuroinflammation ¦ Volume 4 ¦ October 19, 2017