
Page 225 - Read Online
P. 225
Figueroa-Hall et al. TLR4-mediated signaling in CHME-5 cells
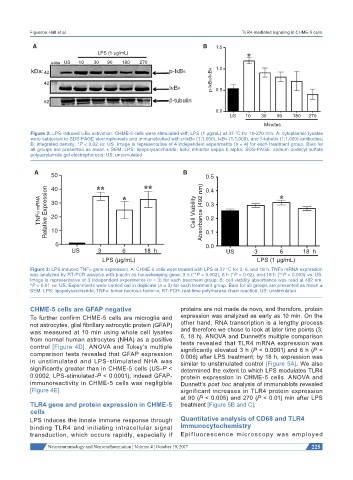
A B 1.5
LPS (1 μg/mL)
ladder US 10 30 90 180 270
kDa: 42 p-IκBα 1.0
42 p-IκBα/IκBα
IκBα 0.5
52 β-tubulin
0.0
US 10 30 90 180 270
Minutes
Figure 2: LPS-induced IκBα activation. CHME-5 cells were stimulated with LPS (1 μg/mL) at 37 °C for 10-270 min. A: cytoplasmic lysates
were subjected to SDS-PAGE electrophoresis and immunoblotted with p-IκBα (1:1,000), IκBα (1:1,000), and β-tubulin (1:1,000) antibodies;
B: integrated density, *P < 0.02 vs. US. Image is representative of 4 independent experiments (n = 4) for each treatment group. Bars for
all groups are presented as mean ± SEM. LPS: lipopolysaccharide; IκBα: inhibitor kappa b alpha; SDS-PAGE: sodium dodecyl sulfate
polyacrylamide gel electrophoresis; US: unstimulated
A 50 B 0.5
40
0.4
TNFα mRNA Relative Expression 30 Cell Viability Absorbance (492 nm) 0.3
20
0.2
10
0 0.1
0.0
US 3 6 18 h US 3 6 18 h
LPS (μg/mL) LPS (1 μg/mL)
Figure 3: LPS-induced TNFα gene expression. A: CHME-5 cells were treated with LPS at 37 °C for 3, 6, and 18 h. TNFα mRNA expression
was analyzed by RT-PCR analysis with β-actin as housekeeping gene, 3 h (**P < 0.002), 6 h (*P < 0.02), and 18 h (**P < 0.003) vs. US.
Image is representative of 3 independent experiments (n = 3) for each treatment group; B: cell viability absorbance was read at 492 nm,
*P < 0.01 vs. US. Experiments were carried out in duplicate (n = 3) for each treatment group. Bars for all groups are presented as mean ±
SEM. LPS: lipopolysaccharide; TNFα: tumor necrosis factor-α; RT-PCR: real-time polymerase chain reaction; US: unstimulated
CHME-5 cells are GFAP negative proteins are not made de novo, and therefore, protein
To further confirm CHME-5 cells are microglia and expression was analyzed as early as 10 min. On the
not astrocytes, glial fibrillary astrocytic protein (GFAP) other hand, RNA transcription is a lengthy process
was measured at 10 min using whole cell lysates and therefore we chose to look at later time points (3,
6, 18 h). ANOVA and Dunnett’s multiple comparison
from normal human astrocytes (NHA) as a positive tests revealed that TLR4 mRNA expression was
control [Figure 4D]. ANOVA and Tukey’s multiple significantly elevated 3 h (P < 0.0001) and 6 h (P <
comparison tests revealed that GFAP expression 0.006) after LPS treatment; by 18 h, expression was
in unstimulated and LPS-stimulated NHA was similar to unstimulated control [Figure 5A]. We also
significantly greater than in CHME-5 cells (US-P < determined the extent to which LPS modulates TLR4
0.0002, LPS-stimulated-P < 0.0001); indeed GFAP- protein expression in CHME-5 cells. ANOVA and
immunoreactivity in CHME-5 cells was negligible Dunnett’s post hoc analysis of immunoblots revealed
[Figure 4E]. significant increases in TLR4 protein expression
at 90 (P < 0.005) and 270 (P < 0.01) min after LPS
TLR4 gene and protein expression in CHME-5 treatment [Figure 5B and C].
cells
LPS induces the innate immune response through Quantitative analysis of CD68 and TLR4
binding TLR4 and initiating intracellular signal immunocytochemistry
transduction, which occurs rapidly, especially if Epifluorescence microscopy was employed
Neuroimmunology and Neuroinflammation ¦ Volume 4 ¦ October 19, 2017 225