
Page 136 - Read Online
P. 136
Chen et al. Characteristics of viral encephalitis with epilepsy
in sensorium. There were significant indications content in CSF was less than 0.15 g/L, and 38 cases
between the two groups in consciousness disturbance of patients whose protein content was between
(P = 0.001) and cognitive dysfunction (P = 0.01), both 0.15 and 0.45 g/L, and 77 cases of patients whose
of which were higher in the epilepsy group. protein content was above 0.45 g/L. There were 12
cases whose glucose content in CSF was less than
In the 39 cases (33.62%) of viral encephalitis with 2.5 mmol/L, and 93 cases of patients whose glucose
epilepsy, there were 25 case(64.10%)in which content was between 2.5 and 4.5 mmol/L, and 11
the main form was generalized seizure, which is cases whose glucose content was above 4.5 mmol/L.
consistent with current domestic reports. There There were 30 cases of patients whose chloride in CSF
[9]
were 7 cases of status epilepticus, 2 cases of simple was less than 120 mmol/L, and 80 cases of patients
partial seizures, 5 cases of complex partial seizures, whose chloride was between 120 and 132 mmol/L.
7 cases of generalized seizures secondary to partial There were non-significant differences between the
seizures. In the 32 cases of non-status epilepsy, there two groups in protein and chloride. However, there
were 12 cases whose duration of seizure was within was significant difference between the two groups in
1 min, 8 with duration of 1 to 5 min, 8 with duration of glucose (P = 0.001), with higher glucose in those with
5 to 10 min, 1 case with duration of 10 to 20 min, and epilepsy. Cytological examination of the CSF showed
another 3 cases with unknown duration. There was 95 cases with mainly increased lymphocytes, 16
a range in the number of epileptic attacks: 13 cases cases were normal, 4 cases were mainly neutrophil
were once; 7 cases were 1 to 5 times; 4 cases were predominant, and 1 case with elevated mononuclear
5 to 10 times; and 8 cases were more than 10 times. cells. One percent of the phagocytes were found in
one case and the same was true for granulocytes and
Examination plasma cells. Four cases were neutrophil predominant,
CSF examinations 3 of them were from the group with epilepsy and one
All patients received a lumbar puncture. There were 53 from the group without epilepsy. A lumbar puncture
cases of patients (45.69%) whose intracranial pressure was performed in the early stages of their disease, and
was higher than 180 mmH O, including 9 cases of in this stage part of patients were mainly neutrophil
2
patients whose intracranial pressure was more than predominant. With the treatment and development of
300 mmH O. The mean encephalic pressure was disease, lymphocytes and monocytes were gradually
2
184.10 ± 64.29 mmH O in the group with epilepsy and increased and prevailed. However, this phenomenon
2
192.92 ± 70.65 mmH O in the group without epilepsy. is rarely seen in clinical practice because patients visit
2
There are non-significant discrepancies between the the hospital out of this period [Table 3].
two groups in encephalic pressure but the incidence
of intracranial hypertension is lower than the study Imaging examination
of Gong et al., which is 58.7%. On the one hand, Brain imaging of viral encephalitis patients, using CT
[10]
some patients received a lumbar puncture in the early or MRI, showed foci mainly located in one or both
stages of disease, and the intracranial pressure did not temporal lobes, followed by frontal lobe, parietal
increase remarkably; on the other hand, some patients lobe, occipital lobe, insula, hippocampus, and other
had been using drugs to reduce intracranial pressure parts of involvement [Table 4]. There were significant
before the lumbar puncture. differences between the two groups in cortical
involvements (P = 0.001) in which patients with
No clot was found in CSF routine examination. Only epilepsy were higher [Table 5].
1 case of patients with epilepsy manifests with yellow
color and slightly mixed, 4 cases of patients were EEG examination
pale red, 111 cases of patients were colorless and According to the book of Clinical
transparent. There was only one case whose protein Electroencephalography written by Feng, EEG
[11]
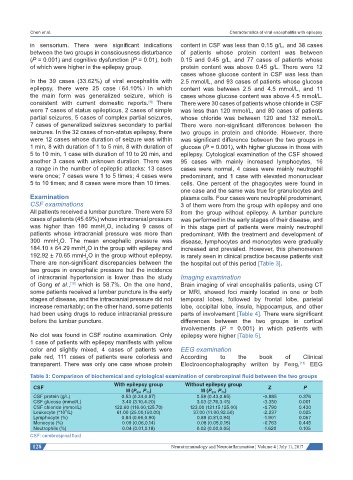
Table 3: Comparison of biochemical and cytological examination of cerebrospinal fluid between the two groups
With epilepsy group Without epilepsy group
CSF Z P
M (P 25 , P 75 ) M (P 25 , P 75 )
CSF protein (g/L) 0.53 (0.34,0.87) 0.58 (0.43,0.85) -0.885 0.376
CSF glucose (mmol/L) 3.40 (3.10,4.20) 3.03 (2.76,3.45) -3.350 0.001
CSF chloride (mmol/L) 122.60 (116.00,125.70) 123.00 (121.15,125.00) -0.790 0.430
6
Leukocyte (*10 /L) 61.00 (25.00,150.00) 37.00 (11.00,92.50) -2.237 0.025
Lymphocyte (%) 0.84 (0.66,0.90) 0.89 (0.81,0.94) -1.901 0.057
Monocyte (%) 0.09 (0.06,0.14) 0.08 (0.05,0.15) -0.763 0.445
Neutrophils (%) 0.04 (0.01,0.18) 0.02 (0.00,0.05) -1.620 0.105
CSF: cerebrospinal fluid
128 Neuroimmunology and Neuroinflammation ¦ Volume 4 ¦ July 11, 2017