
Page 54 - Read Online
P. 54
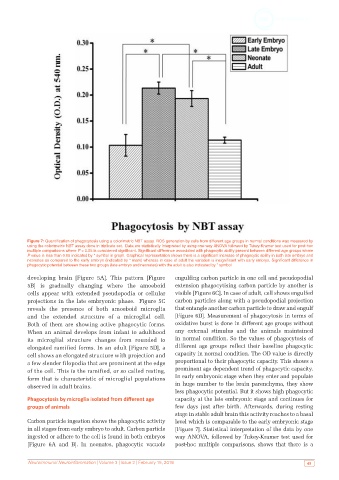
Figure 7: Quantification of phagocytosis using a colorimetric NBT assay. ROS generation by cells from different age groups in normal conditions was measured by
           using the colorimetric NBT assay done in triplicate set.  Data are statistically interpreted by using one-way ANOVA followed by Tukey-Kramer test used for post-hoc
           multiple comparisons where P < 0.05 is considered significant. Significant difference associated with phagocytic ability present between different age groups where
           P value is less than 0.05 indicated by * symbol in graph. Graphical representation shows there is a significant increase of phagocytic ability in both late embryo and
           neonates as compared to the early embryo (indicated by * mark) whereas in case of adult the variation is insignificant with early embryo. Significant difference in
           phagocytic potential between these two groups (late embryo and neonates) with the adult is also indicated by * symbol
           developing brain [Figure 5A]. This pattern [Figure   engulfing carbon particle in one cell and pseudopodial
           5B] is gradually changing where the amoeboid        extension phagocytising carbon particle by another is
           cells appear with extended  pseudopodia or cellular   visible [Figure 6C]. In case of adult, cell shows engulfed
           projections in the late embryonic phase.  Figure 5C   carbon particles along with a pseudopodial projection
           reveals the  presence  of both amoeboid microglia   that entangle another carbon particle to draw and engulf
           and the extended structure of a microglial cell.    [Figure 6D]. Measurement of phagocytosis in terms of
           Both of them are  showing active  phagocytic forms.   oxidative burst is done in different age groups without
           When an animal develops from infant to adulthood    any external stimulus and the animals maintained
           its microglial  structure changes from rounded  to   in normal condition. So the values of phagocytosis of
           elongated ramified forms. In an adult [Figure 5D], a   different age groups  reflect  their  baseline phagocytic
           cell shows an elongated structure with projection and   capacity in normal condition. The OD value is directly
           a few slender filopodia that are prominent at the edge   proportional to their phagocytic capacity. This shows a
           of the cell. This is the ramified, or so called resting,   prominent age dependent trend of phagocytic capacity.
           form that is characteristic of microglial populations   In early embryonic stage when they enter and populate
           observed in adult brains.                           in huge number to the brain parenchyma, they show
                                                               less phagocytic potential. But it shows high phagocytic
           Phagocytosis by microglia isolated from different age   capacity at the late embryonic stage and continues for
           groups of animals                                   few days just after birth. Afterwards, during resting
                                                               stage in stable adult brain this activity reaches to a basal
           Carbon particle ingestion shows the phagocytic activity   level which is comparable to the early embryonic stage
           in all stages from early embryo to adult. Carbon particle   [Figure 7]. Statistical interpretation of the data by one
           ingested or adhere to the cell is found in both embryos   way ANOVA, followed by Tukey-Kramer test used for
           [Figure 6A and B]. In neonates, phagocytic vacuole   post-hoc multiple comparisons, shows that there is a


           Neuroimmunol Neuroinflammation | Volume 3 | Issue 2 | February 15, 2016                           45