
Page 13 - Read Online
P. 13
Singh et al. Mini-invasive Surg. 2025;9:28 https://dx.doi.org/10.20517/2574-1225.2024.75 Page 7 of 25
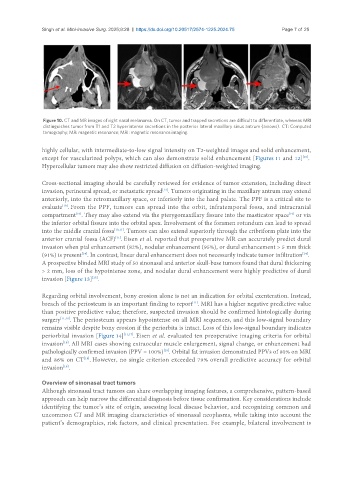
Figure 10. CT and MR images of right nasal melanoma. On CT, tumor and trapped secretions are difficult to differentiate, whereas MRI
distinguishes tumor from T1 and T2 hyperintense secretions in the posterior lateral maxillary sinus antrum (arrows). CT: Computed
tomography; MR: magnetic resonance; MRI: magnetic resonance imaging.
highly cellular, with intermediate-to-low signal intensity on T2-weighted images and solid enhancement,
except for vascularized polyps, which can also demonstrate solid enhancement [Figures 11 and 12] .
[10]
Hypercellular tumors may also show restricted diffusion on diffusion-weighted imaging.
Cross-sectional imaging should be carefully reviewed for evidence of tumor extension, including direct
[13]
invasion, perineural spread, or metastatic spread . Tumors originating in the maxillary antrum may extend
anteriorly, into the retromaxillary space, or inferiorly into the hard palate. The PPF is a critical site to
[10]
evaluate . From the PPF, tumors can spread into the orbit, infratemporal fossa, and intracranial
compartment . They may also extend via the pterygomaxillary fissure into the masticator space or via
[10]
[10]
the inferior orbital fissure into the orbital apex. Involvement of the foramen rotundum can lead to spread
into the middle cranial fossa [10,11] . Tumors can also extend superiorly through the cribriform plate into the
anterior cranial fossa (ACF) . Eisen et al. reported that preoperative MR can accurately predict dural
[11]
invasion when pial enhancement (82%), nodular enhancement (95%), or dural enhancement > 5 mm thick
[14]
[14]
(91%) is present . In contrast, linear dural enhancement does not necessarily indicate tumor infiltration .
A prospective blinded MRI study of 50 sinonasal and anterior skull-base tumors found that dural thickening
> 2 mm, loss of the hypointense zone, and nodular dural enhancement were highly predictive of dural
[15]
invasion [Figure 13] .
Regarding orbital involvement, bony erosion alone is not an indication for orbital exenteration. Instead,
breach of the periosteum is an important finding to report . MRI has a higher negative predictive value
[11]
than positive predictive value; therefore, suspected invasion should be confirmed histologically during
surgery [11,16] . The periosteum appears hypointense on all MRI sequences, and this low-signal boundary
remains visible despite bony erosion if the periorbita is intact. Loss of this low-signal boundary indicates
periorbital invasion [Figure 14] [11,17] . Eisen et al. evaluated ten preoperative imaging criteria for orbital
[18]
invasion . All MRI cases showing extraocular muscle enlargement, signal change, or enhancement had
pathologically confirmed invasion (PPV = 100%) . Orbital fat invasion demonstrated PPVs of 80% on MRI
[18]
[18]
and 86% on CT . However, no single criterion exceeded 79% overall predictive accuracy for orbital
invasion .
[18]
Overview of sinonasal tract tumors
Although sinonasal tract tumors can share overlapping imaging features, a comprehensive, pattern-based
approach can help narrow the differential diagnosis before tissue confirmation. Key considerations include
identifying the tumor’s site of origin, assessing local disease behavior, and recognizing common and
uncommon CT and MR imaging characteristics of sinonasal neoplasms, while taking into account the
patient’s demographics, risk factors, and clinical presentation. For example, bilateral involvement is