
Page 150 - Read Online
P. 150
Page 440 Gropman et al. J Transl Genet Genom 2020;4:429-45 I http://dx.doi.org/10.20517/jtgg.2020.09
A
B
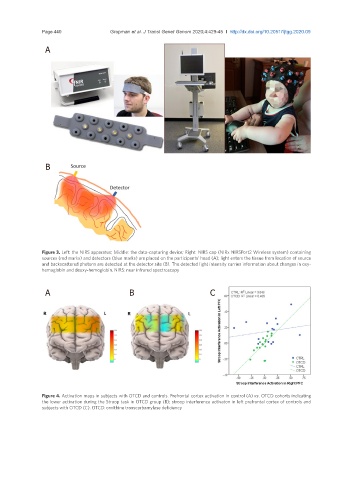
Figure 3. Left: the NIRS apparatus; Middle: the data-capturing device; Right: NIRS cap (NIRx NIRSPort2 Wireless system) containing
sources (red marks) and detectors (blue marks) are placed on the participants’ head (A); light enters the tissue from location of source
and backscattered photons are detected at the detector site (B). The detected light intensity carries information about changes in oxy-
hemoglobin and deoxy-hemoglobin. NIRS: near infrared spectroscopy
A B C
Figure 4. Activation maps in subjects with OTCD and controls. Prefrontal cortex activation in control (A) vs. OTCD cohorts indicating
the lower activation during the Stroop task in OTCD group (B); stroop interference activaton in left prefrontal cortex of controls and
subjects with OTCD (C). OTCD: ornithine transcarbamylase deficiency