
Page 146 - Read Online
P. 146
Page 436 Gropman et al. J Transl Genet Genom 2020;4:429-45 I http://dx.doi.org/10.20517/jtgg.2020.09
A
B
C
1
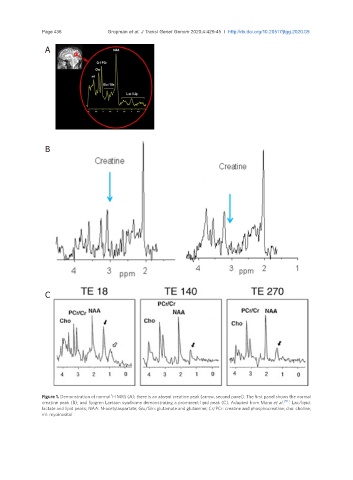
Figure 1. Demonstration of normal H MRS (A); there is an absent creatine peak (arrow, second panel). The first panel shows the normal
creatine peak (B); and Sjogren Larsson syndrome demonstrating a prominent lipid peak (C). Adapted from Mano et al. [50] . Lac/lipid:
lactate and lipid peaks; NAA: N-acetylaspartate; Glu/Gln: glutamate and glutamine; Cr/PCr: creatine and phosphocreatine; cho: choline;
mI: myoinositol