


Page 34 - Read Online
P. 34
Liu et al. J. Mater. Inf. 2025, 5, 27  I http://dx.doi.org/10.20517/jmi.2024.105  Page 11 of 18


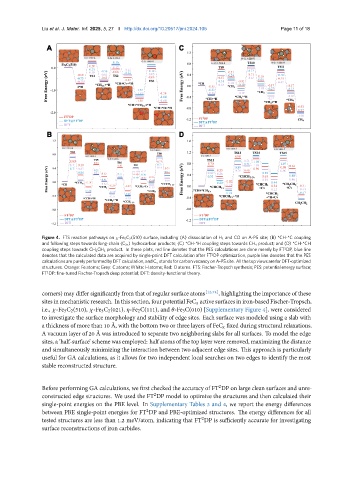
               Figure 4. FTS reaction pathways on   -Fe 5C 2(510) surface, including (A) dissociation of H 2 and CO on A-P5 site; (B) *CH-*C coupling
               and following steps towards long-chain (C 2+) hydrocarbon products; (C) *CH-*H coupling steps towards CH 4 product; and (D) *CH-*CH
                                                                                                 2
               coupling steps towards CH 2CH 2 product. In these plots, red line denotes that the PES calculations are done merely by FT DP, blue line
                                                                        2
               denotes that the calculated data are acquired by single-point DFT calculation after FT DP optimization, purple line denotes that the PES
               calculations are purely performed by DFT calculation, and C    stands for carbon vacancy on A-P5 site. All the top views are for DFT-optimized
               structures. Orange: Fe atoms; Grey: C atoms; White: H atoms; Red: O atoms. FTS: Fischer-Tropsch synthesis; PES: potential energy surface;
               FT DP: fine-tuned Fischer-Tropsch deep potential; DFT: density-functional theory.
                 2
               corners) may differ significantly from that of regular surface atoms [12,74] , highlighting the importance of these
               sitesin mechanistic research. In this section, four potential FeC    active surfaces in iron-based Fischer-Tropsch,
               i.e.,   -Fe 5C 2(510),   -Fe 5C 2(021),   -Fe 2C(111), and   -Fe 3C(010) [Supplementary Figure 4], were considered
               to investigate the surface morphology and stability of edge sites. Each surface was modeled using a slab with
               a thickness of more than 10 Å, with the bottom two or three layers of FeC    fixed during structural relaxations.
               A vacuum layer of 20 Å was introduced to separate two neighboring slabs for all surfaces. To model the edge
               sites, a ‘half-surface’ scheme was employed: half atoms of the top layer were removed, maximizing the distance
               and simultaneously minimizing the interaction between two adjacent edge sites. This approach is particularly
               useful for GA calculations, as it allows for two independent local searches on two edges to identify the most
               stable reconstructed structure.


               Before performing GA calculations, we first checked the accuracy of FT DP on large clean surfaces and unre-
                                                                           2
               constructed edge structures. We used the FT DP model to optimize the structures and then calculated their
                                                     2
               single-point energies on the PBE level. In Supplementary Tables 3 and 4, we report the energy differences
               between PBE single-point energies for FT DP and PBE-optimized structures. The energy differences for all
                                                  2
               tested structures are less than 1.2 meV/atom, indicating that FT DP is sufficiently accurate for investigating
                                                                     2
               surface reconstructions of iron carbides.

