


Page 31 - Read Online
P. 31
Page 8 of 18                       Liu et al. J. Mater. Inf. 2025, 5, 27  I http://dx.doi.org/10.20517/jmi.2024.105


                                            2
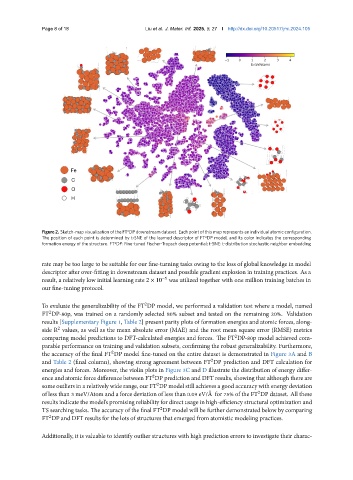
               Figure 2. Sketch-map visualization of the FT DP downstream dataset. Each point of this map represents an individual atomic configuration.
                                                                      2
               The position of each point is determined by t-SNE of the learned descriptor of FT DP model, and its color indicates the corresponding
                                        2
               formation energy of the structure. FT DP: Fine-tuned Fischer-Tropsch deep potential; t-SNE: t-distribution stochastic neighbor embedding
               rate may be too large to be suitable for our fine-turning tasks owing to the loss of global knowledge in model
               descriptor after over-fitting in downstream dataset and possible gradient explosion in training practices. As a
               result, a relatively low initial learning rate 2 × 10 was utilized together with one million training batches in
                                                        −5
               our fine-tuning protocol.


               To evaluate the generalizability of the FT DP model, we performed a validation test where a model, named
                                                  2
               FT DP-80p, was trained on a randomly selected 80% subset and tested on the remaining 20%. Validation
                  2
               results [Supplementary Figure 1, Table 2] present parity plots of formation energies and atomic forces, along-
               side R values, as well as the mean absolute error (MAE) and the root mean square error (RMSE) metrics
                    2
               comparing model predictions to DFT-calculated energies and forces. The FT DP-80p model achieved com-
                                                                                2
               parable performance on training and validation subsets, confirming the robust generalizability. Furthermore,
               the accuracy of the final FT DP model fine-tuned on the entire dataset is demonstrated in Figure 3A and B
                                       2
               and Table 2 (final column), showing strong agreement between FT DP prediction and DFT calculation for
                                                                        2
               energies and forces. Moreover, the violin plots in Figure 3C and D illustrate the distribution of energy differ-
               ence and atomic force difference between FT DP prediction and DFT results, showing that although there are
                                                    2
               some outliers in a relatively wide range, our FT DP model still achieves a good accuracy with energy deviation
                                                      2
               of less than 3 meV/Atom and a force deviation of less than 0.09 eV/Å for 75% of the FT DP dataset. All these
                                                                                        2
               results indicate the model’s promising reliability for direct usage in high-efficiency structural optimization and
               TS searching tasks. The accuracy of the final FT DP model will be further demonstrated below by comparing
                                                       2
               FT DP and DFT results for the lots of structures that emerged from atomistic modeling practices.
                  2
               Additionally, it is valuable to identify outlier structures with high prediction errors to investigate their charac-

