


Page 32 - Read Online
P. 32
Liu et al. J. Mater. Inf. 2025, 5, 27  I http://dx.doi.org/10.20517/jmi.2024.105  Page 9 of 18

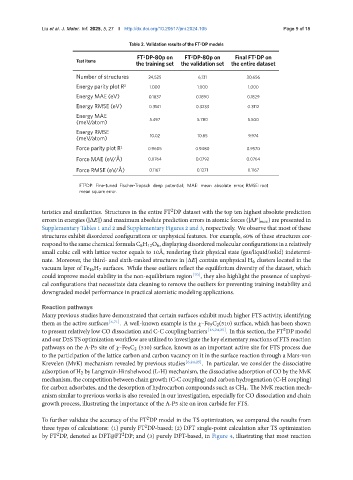
                                             Table 2. Validation results of the FT DP models
                                                                     2
                                                 2
                                               FT DP-80p on    FT DP-80p on     Final FT DP on
                                                                                       2
                                                                 2
                           Test items
                                               the training set  the validation set  the entire dataset
                           Number of structures    24,525           6,131           30,656
                           Energy parity plot R 2  1.000            1.000            1.000
                           Energy MAE (eV)         0.1837          0.1890           0.1829
                           Energy RMSE (eV)        0.3141          0.3233            0.3112
                           Energy MAE
                           (meV/atom)              5.497           5.780             5.500
                           Energy RMSE
                           (meV/atom)               10.02           10.85            9.974
                           Force parity plot R 2   0.9605          0.9480           0.9570
                           Force MAE (eV/Å)        0.0764          0.0792           0.0764
                           Force RMSE (eV/Å)       0.1167          0.1271            0.1167


                              2
                            FT DP: Fine-tuned Fischer-Tropsch deep potential; MAE: mean absolute error; RMSE: root
                            mean square error.

               teristics and similarities. Structures in the entire FT DP dataset with the top ten highest absolute prediction
                                                           2
               errors in energies (|Δ  |) and maximum absolute prediction errors in atomic forces (|Δ  |       ) are presented in
               Supplementary Tables 1 and 2 and Supplementary Figures 2 and 3, respectively. We observe that most of these
               structures exhibit disordered configurations or unphysical features. For example, 60% of these structures cor-
               respondtothe samechemicalformula C 6H 12O 6, displayingdisordered molecularconfigurationsin a relatively
               small cubic cell with lattice vector equals to 10Å, rendering their physical state (gas/liquid/solid) indetermi-
               nate. Moreover, the third- and sixth-ranked structures in |Δ  | contain unphysical H 6 clusters located in the
               vacuum layer of Fe 16H 7 surfaces. While these outliers reflect the equilibrium diversity of the dataset, which
               could improve model stability in the non-equilibrium region [70] , they also highlight the presence of unphysi-
               cal configurations that necessitate data cleaning to remove the outliers for preventing training instability and
               downgraded model performance in practical atomistic modeling applications.

               Reaction pathways
               Many previous studies have demonstrated that certain surfaces exhibit much higher FTS activity, identifying
               them as the active surfaces [6,71] . A well-known example is the   -Fe 5C 2(510) surface, which has been shown
               to present relatively low CO dissociation and C-C coupling barriers [16,24,25] . In this section, the FT DP model
                                                                                                 2
               and our D2S TS optimization workflow are utilized to investigate the key elementary reactions of FTS reaction
               pathways on the A-P5 site of   -Fe 5C 2 (510) surface, known as an important active site for FTS process due
               to the participation of the lattice carbon and carbon vacancy on it in the surface reaction through a Mars-von
               Krevelen (MvK) mechanism revealed by previous studies [6,24,25] . In particular, we consider the dissociative
               adsorption of H 2 by Langmuir-Hinshelwood (L-H) mechanism, the dissociative adsorption of CO by the MvK
               mechanism, the competition between chaingrowth (C-C coupling) and carbon hydrogenation (C-H coupling)
               for carbon adsorbates, and the desorption of hydrocarbon compounds such as CH 4. The MvK reaction mech-
               anism similar to previous works is also revealed in our investigation, especially for CO dissociation and chain
               growth process, illustrating the importance of the A-P5 site on iron carbide for FTS.


               To further validate the accuracy of the FT DP model in the TS optimization, we compared the results from
                                                  2
               three types of calculations: (1) purely FT DP-based; (2) DFT single-point calculation after TS optimization
                                                  2
               by FT DP, denoted as DFT@FT DP; and (3) purely DFT-based, in Figure 4, illustrating that most reaction
                    2
                                          2

