


Page 33 - Read Online
P. 33
Page 10 of 18                      Liu et al. J. Mater. Inf. 2025, 5, 27  I http://dx.doi.org/10.20517/jmi.2024.105


                                        2
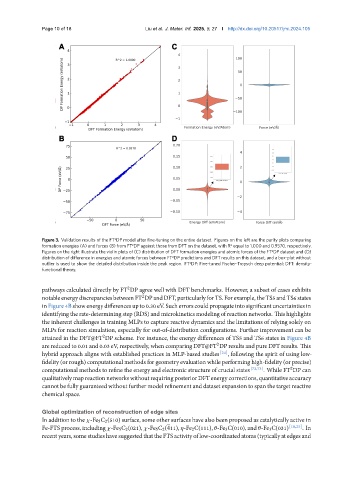
               Figure 3. Validation results of the FT DP model after fine-tuning on the entire dataset. Figures on the left are the parity plots comparing
                                                                               2
                                              2
               formation energies (A) and forces (B) from FT DP against those from DFT on the dataset, with R equal to 1.000 and 0.9570, respectively.
               Figures on the right illustrate the violin plots of (C) distribution of DFT formation energies and atomic forces of the FT DP dataset and (D)
                                                                                             2
               distribution of difference in energies and atomic forces between FT DP predictions and DFT results on this dataset, and a box-plot without
                                                           2
                                                                 2
               outlier is used to show the detailed distribution inside the peak region. FT DP: Fine-tuned Fischer-Tropsch deep potential; DFT: density-
               functional theory.
               pathways calculated directly by FT DP agree well with DFT benchmarks. However, a subset of cases exhibits
                                            2
               notableenergydiscrepanciesbetweenFT DPandDFT,particularlyforTS.Forexample,theTS5andTS6states
                                                 2
               inFigure4Bshowenergydifferencesupto0.30eV.Sucherrorscouldpropagateintosignificantuncertaintiesin
               identifying the rate-determining step (RDS) and microkinetics modeling of reaction networks. This highlights
               the inherent challenges in training MLPs to capture reactive dynamics and the limitations of relying solely on
               MLPs for reaction simulation, especially for out-of-distribution configurations. Further improvement can be
               attained in the DFT@FT DP scheme. For instance, the energy differences of TS5 and TS6 states in Figure 4B
                                    2
               are reduced to 0.01 and 0.03 eV, respectively, when comparing DFT@FT DP results and pure DFT results. This
                                                                          2
               hybrid approach aligns with established practices in MLP-based studies [24] , following the spirit of using low-
               fidelity (or rough) computational methods for geometry evaluation while performing high-fidelity (or precise)
               computational methods to refine the energy and electronic structure of crucial states [72,73] . While FT DP can
                                                                                                   2
               qualitativelymapreactionnetworkswithoutrequiringposteriorDFTenergycorrections, quantitativeaccuracy
               cannot be fully guaranteed without further model refinement and dataset expansion to span the target reactive
               chemical space.


               Global optimization of reconstruction of edge sites
               In addition to the   -Fe 5C 2(510) surface, some other surfaces have also been proposed as catalytically active in
               Fe-FTS process, including   -Fe 5C 2(021),   -Fe 5C 2(411),   -Fe 2C(111),   -Fe 3C(010), and   -Fe 3C(031) [18,25] . In
               recentyears, somestudieshavesuggestedthattheFTSactivityoflow-coordinatedatoms(typicallyatedgesand

