


Page 14 - Read Online
P. 14
Page 8 of 17                     Schertzer et al. J. Mater. Inf. 2025, 5, 5  https://dx.doi.org/10.20517/jmi.2024.69


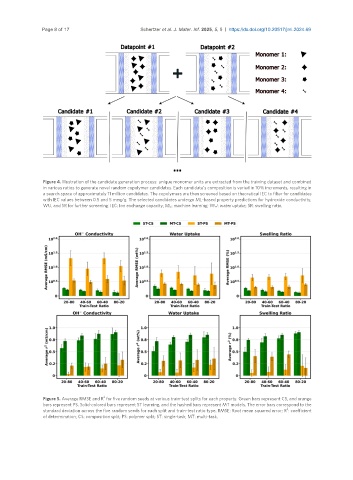
                Figure 4. Illustration of the candidate generation process: unique monomer units are extracted from the training dataset and combined
                in various ratios to generate novel random copolymer candidates. Each candidate’s composition is varied in 10% increments, resulting in
                a search space of approximately 11 million candidates. The copolymers are then screened based on theoretical IEC to filter for candidates
                with IEC values between 0.5 and 5 meq/g. The selected candidates undergo ML-based property predictions for hydroxide conductivity,
                WU, and SR for further screening. IEC: Ion exchange capacity; ML: machine learning; WU: water uptake; SR: swelling ratio.


                                    2
                Figure 5. Average RMSE and R  for five random seeds at various train-test splits for each property. Green bars represent CS, and orange
                bars represent PS. Solid-colored bars represent ST learning, and the hashed bars represent MT models. The error bars correspond to the
                                                                                                  2
                standard deviation across the five random seeds for each split and train-test ratio type. RMSE: Root mean squared error; R : coefficient
                of determination; CS: composition split; PS: polymer split; ST: single-task; MT: multi-task.

