


Page 17 - Read Online
P. 17
Schertzer et al. J. Mater. Inf. 2025, 5, 5  https://dx.doi.org/10.20517/jmi.2024.69  Page 11 of 17


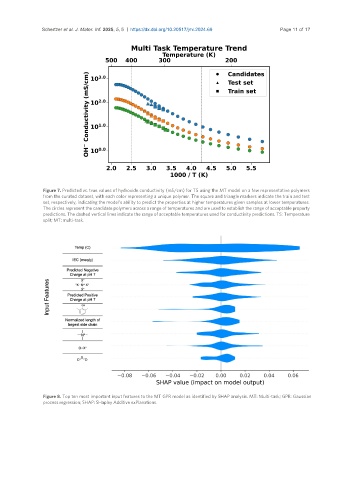
                Figure 7. Predicted vs. true values of hydroxide conductivity (mS/cm) for TS using the MT model on a few representative polymers
                from the curated dataset, with each color representing a unique polymer. The square and triangle markers indicate the train and test
                set, respectively, indicating the model’s ability to predict the properties at higher temperatures given samples at lower temperatures.
                The circles represent the candidate polymers across a range of temperatures and are used to establish the range of acceptable property
                predictions. The dashed vertical lines indicate the range of acceptable temperatures used for conductivity predictions. TS: Temperature
                split; MT: multi-task.


                Figure 8. Top ten most important input features to the MT GPR model as identified by SHAP analysis. MT: Multi-task; GPR: Gaussian
                process regression; SHAP: SHapley Additive exPlanations.

