


Page 88 - Read Online
P. 88
Page 10 of 20                      Gesch et al. J. Mater. Inf. 2025, 5, 42  https://dx.doi.org/10.20517/jmi.2025.23


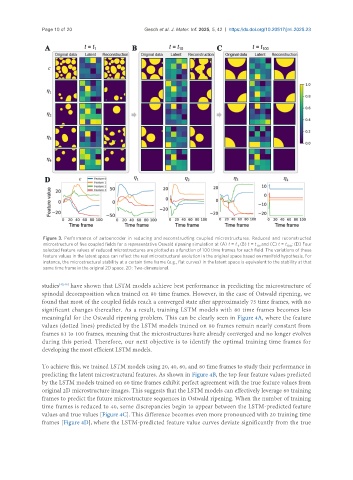
                Figure 3. Performance of autoencoder in reducing and reconstructing coupled microstructures. Reduced and reconstructed
                microstructure of five coupled fields for a representative Oswald ripening simulation at (A) t = t , (B) t = t , and (C) t = t  ; (D) Four
                                                                                 1      10        100
                selected feature values of reduced microstructures are plotted as a function of 100 time frames for each field. The variations of these
                feature values in the latent space can reflect the real microstructural evolution in the original space based on manifold hypothesis. For
                instance, the microstructural stability at a certain time frame (e.g., flat curves) in the latent space is equivalent to the stability at that
                same time frame in the original 2D space. 2D: Two-dimensional.

               studies [45,46]  have shown that LSTM models achieve best performance in predicting the microstructure of
               spinodal decomposition when trained on 80 time frames. However, in the case of Ostwald ripening, we
               found that most of the coupled fields reach a converged state after approximately 75 time frames, with no
               significant changes thereafter. As a result, training LSTM models with 80 time frames becomes less
               meaningful for the Ostwald ripening problem. This can be clearly seen in Figure 4A, where the feature
               values (dotted lines) predicted by the LSTM models trained on 80 frames remain nearly constant from
               frames 81 to 100 frames, meaning that the microstructures have already converged and no longer evolves
               during this period. Therefore, our next objective is to identify the optimal training time frames for
               developing the most efficient LSTM models.

               To achieve this, we trained LSTM models using 20, 40, 60, and 80 time frames to study their performance in
               predicting the latent microstructural features. As shown in Figure 4B, the top four feature values predicted
               by the LSTM models trained on 60 time frames exhibit perfect agreement with the true feature values from
               original 2D microstructure images. This suggests that the LSTM models can effectively leverage 60 training
               frames to predict the future microstructure sequences in Ostwald ripening. When the number of training
               time frames is reduced to 40, some discrepancies begin to appear between the LSTM-predicted feature
               values and true values [Figure 4C]. This difference becomes even more pronounced with 20 training time
               frames [Figure 4D], where the LSTM-predicted feature value curves deviate significantly from the true

