


Page 90 - Read Online
P. 90
Page 12 of 20                      Gesch et al. J. Mater. Inf. 2025, 5, 42  https://dx.doi.org/10.20517/jmi.2025.23


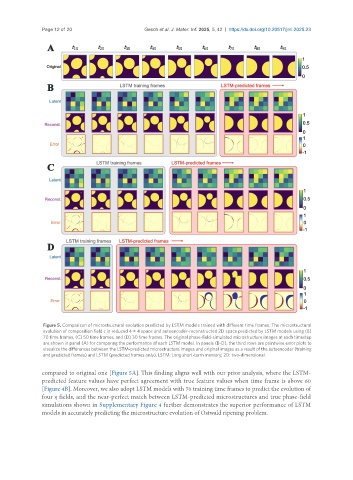
                Figure 5. Comparison of microstructural evolution predicted by LSTM models trained with different time frames. The microstructural
                evolution of composition field c in reduced 4 × 4 space and autoencoder-reconstructed 2D space predicted by LSTM models using (B)
                70 time frames, (C) 50 time frames, and (D) 30 time frames. The original phase-field-simulated microstructure images at each timestep
                are shown in panel (A) for comparing the performance of each LSTM model. In panels (B-D), the third rows are pointwise error plots to
                visualize the differences between the LSTM-predicted microstructure images and original images as a result of the autoencoder (training
                and predicted frames) and LSTM (predicted frames only). LSTM: Long short-term memory; 2D: two-dimensional.


               compared to original one [Figure 5A]. This finding aligns well with our prior analysis, where the LSTM-
               predicted feature values have perfect agreement with true feature values when time frame is above 60
               [Figure 4B]. Moreover, we also adopt LSTM models with 70 training time frames to predict the evolution of
               four η fields, and the near-perfect match between LSTM-predicted microstructures and true phase-field
               simulations shown in Supplementary Figure 4 further demonstrates the superior performance of LSTM
               models in accurately predicting the microstructure evolution of Ostwald ripening problem.

