


Page 17 - Read Online
P. 17
Page 10 of 20                           Li et al. J Mater Inf 2024;4:27  https://dx.doi.org/10.20517/jmi.2024.44


                                      2
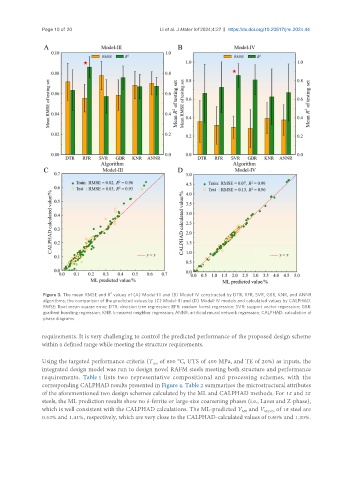
                Figure 3. The mean RMSE and R  values of (A) Model-III and (B) Model-IV constructed by DTR, RFR, SVR, GBR, KNR, and ANNR
                algorithms; the comparison of the predicted values by (C) Model-III and (D) Model-IV models and calculated values by CALPHAD.
                RMSE: Root mean square error; DTR: decision tree regression; RFR: random forest regression; SVR: support vector regression; GBR:
                gradient boosting regression; KNR: k-nearest neighbor regression; ANNR: artificial neural network regression; CALPHAD: calculation of
                phase diagrams.

               requirements. It is very challenging to control the predicted performance of the proposed design scheme
               within a defined range while meeting the structure requirements.

               Using the targeted performance criteria (T  of 600 °C, UTS of 400 MPa, and TE of 20%) as inputs, the
                                                    test
               integrated design model was run to design novel RAFM steels meeting both structure and performance
               requirements.  Table 1  lists  two  representative  compositional  and  processing  schemes,  with  the
               corresponding CALPHAD results presented in Figure 4. Table 2 summarizes the microstructural attributes
               of the aforementioned two design schemes calculated by the ML and CALPHAD methods. For 1# and 2#
               steels, the ML prediction results show no δ-ferrite or large-size coarsening phases (i.e., Laves and Z-phase),
               which is well consistent with the CALPHAD calculations. The ML-predicted V  and V M23C6  of 1# steel are
                                                                                   MX
               0.52% and 1.41%, respectively, which are very close to the CALPHAD-calculated values of 0.60% and 1.30%.

