


Page 12 - Read Online
P. 12
Page 6 of 20                            Li et al. J Mater Inf 2024;4:27  https://dx.doi.org/10.20517/jmi.2024.44

               where n is the number of samples; y and y represent the measured and predicted values of the i-th sample
                                                   i
                                              i
               (i = 1, 2, …, n), respectively; and y is the mean of the measured values. In theory, a perfectly accurate model
                                             2
               would have an RMSE of 0 and an R  of 1. The predictive performance of these models was evaluated using
               the hold-out method. The 80% of the normalized dataset was used for training, and the remaining 20% was
               utilized to assess model errors. According to a pedagogical analysis by Gholamy et al., this 80:20 split was
                                                                              [38]
               determined to be the optimal division between training and testing datasets .
               Experimental procedures
               According to the designed compositions in Table 1, two 10 kg ingots were produced by vacuum induction
               melting. The ingots were homogenized at 1,200 °C for two hours before being processed through hot
               forging and hot rolling to a thickness of 16 mm. Subsequently, according to heat treatment parameters listed
               in Table 1, two 16-mm thick plates were normalized and tempered followed by air cooling. The
               microstructural features of the RAFM steels were analyzed through scanning electron microscopy (SEM)
               and transmission electron microscopy (TEM). For SEM characterization, the samples were etched with a
               mixed solution (2% hydrofluoric acid + 2% nitric acid + 96% de-ionized water) after mechanical polishing.
               TEM samples were prepared by mechanical polishing followed by twin-jet polishing in a solution of 90%
               ethanol and 10% perchloric acid at 20 V and -35 °C. To ensure reliable dislocation density measurements,
               the line intersection method described in Refs. [39,40]  was applied to at least three different TEM micrographs.
               For non-spherical MX and M C  particles, two perpendicular axes (a and b) were measured by Image J
                                         23
                                            6
               software based on more than ten TEM micrographs, and their average diameter (d) was calculated as (a + b)
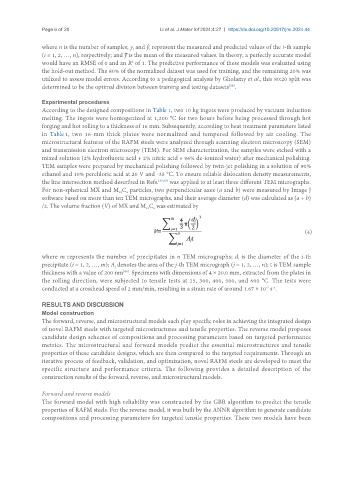
               /2. The volume fraction (V) of MX and M C  was estimated by
                                                  23 6


                                                                                                        (4)


               where m represents the number of precipitates in n TEM micrographs; d  is the diameter of the i-th
                                                                                 i
               precipitate (i = 1, 2, …, m); A denotes the area of the j-th TEM micrograph (j = 1, 2, …, n); t is TEM sample
                                        j
               thickness with a value of 200 nm . Specimens with dimensions of 4 × 20.0 mm, extracted from the plates in
                                           [40]
               the rolling direction, were subjected to tensile tests at 25, 300, 400, 500, and 600 °C. The tests were
               conducted at a crosshead speed of 2 mm/min, resulting in a strain rate of around 1.67 × 10  s .
                                                                                           -3 -1

               RESULTS AND DISCUSSION
               Model construction
               The forward, reverse, and microstructural models each play specific roles in achieving the integrated design
               of novel RAFM steels with targeted microstructures and tensile properties. The reverse model proposes
               candidate design schemes of compositions and processing parameters based on targeted performance
               metrics. The microstructural and forward models predict the essential microstructures and tensile
               properties of these candidate designs, which are then compared to the targeted requirements. Through an
               iterative process of feedback, validation, and optimization, novel RAFM steels are developed to meet the
               specific structure and performance criteria. The following provides a detailed description of the
               construction results of the forward, reverse, and microstructural models.


               Forward and reverse models
               The forward model with high reliability was constructed by the GBR algorithm to predict the tensile
               properties of RAFM steels. For the reverse model, it was built by the ANNR algorithm to generate candidate
               compositions and processing parameters for targeted tensile properties. These two models have been

