
Page 72 - Read Online
P. 72
Page 10 of 15 Gao et al. J Mater Inf 2023;3:6 https://dx.doi.org/10.20517/jmi.2023.03
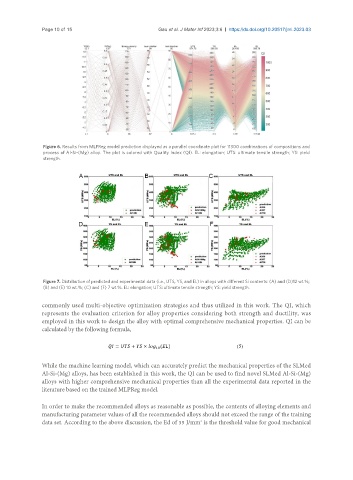
Figure 6. Results from MLPReg model prediction displayed as a parallel coordinate plot for 11300 combinations of compositions and
process of Al-Si-(Mg) alloy. The plot is colored with Quality Index (QI). EL: elongation; UTS: ultimate tensile strength; YS: yield
strength.
Figure 7. Distribution of predicted and experimental data (i.e., UTS, YS, and EL) in alloys with different Si contents: (A) and (D)12 wt.%;
(B) and (E) 10 wt.%; (C) and (F) 7 wt.%. EL: elongation; UTS: ultimate tensile strength; YS: yield strength.
commonly used multi-objective optimization strategies and thus utilized in this work. The QI, which
represents the evaluation criterion for alloy properties considering both strength and ductility, was
employed in this work to design the alloy with optimal comprehensive mechanical properties. QI can be
calculated by the following formula,
While the machine learning model, which can accurately predict the mechanical properties of the SLMed
Al-Si-(Mg) alloys, has been established in this work, the QI can be used to find novel SLMed Al-Si-(Mg)
alloys with higher comprehensive mechanical properties than all the experimental data reported in the
literature based on the trained MLPReg model.
In order to make the recommended alloys as reasonable as possible, the contents of alloying elements and
manufacturing parameter values of all the recommended alloys should not exceed the range of the training
data set. According to the above discussion, the Ed of 35 J/mm is the threshold value for good mechanical
3