
Page 73 - Read Online
P. 73
Gao et al. J Mater Inf 2023;3:6 https://dx.doi.org/10.20517/jmi.2023.03 Page 11 of 15
Table 1. Presently designed alloys with respective maximum UTS, maximum YS, maximum EL, and maximum QI under as-build
conditions
Group W(Si) (wt%) W(Mg) (wt%) Ed (J/mm ) Rotation (°) Direction (°) UTS (MPa) YS (MPa) EL (%) QI (MPa)
3
1 12.1 0.6 36 67 90 559.0 344.8 6.2 831.5
2 12.1 0.6 36 73 0 548.9 362.8 7.4 863.7
3 4.1 0 96 90 0 307.4 162.9 24.5 533.8
4 10.1 0.1 66 90 0 549.4 346.1 16.1 966.8
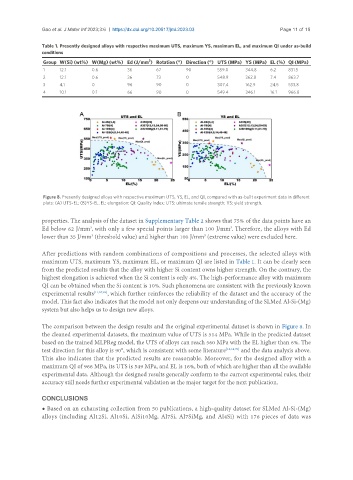
Figure 8. Presently designed alloys with respective maximum UTS, YS, EL, and QI, compared with as-built experiment data in different
plots: (A) UTS~EL; (B)YS~EL. EL: elongation; QI: Quality Index; UTS: ultimate tensile strength; YS: yield strength.
properties. The analysis of the dataset in Supplementary Table 2 shows that 75% of the data points have an
Ed below 62 J/mm , with only a few special points larger than 100 J/mm . Therefore, the alloys with Ed
3
3
3
3
lower than 35 J/mm (threshold value) and higher than 100 J/mm (extreme value) were excluded here.
After predictions with random combinations of compositions and processes, the selected alloys with
maximum UTS, maximum YS, maximum EL, or maximum QI are listed in Table 1. It can be clearly seen
from the predicted results that the alloy with higher Si content owns higher strength. On the contrary, the
highest elongation is achieved when the Si content is only 4%. The high-performance alloy with maximum
QI can be obtained when the Si content is 10%. Such phenomena are consistent with the previously known
experimental results [11,57,83] , which further reinforces the reliability of the dataset and the accuracy of the
model. This fact also indicates that the model not only deepens our understanding of the SLMed Al-Si-(Mg)
system but also helps us to design new alloys.
The comparison between the design results and the original experimental dataset is shown in Figure 8. In
the cleaned experimental datasets, the maximum value of UTS is 514 MPa. While in the predicted dataset
based on the trained MLPReg model, the UTS of alloys can reach 560 MPa with the EL higher than 6%. The
test direction for this alloy is 90°, which is consistent with some literature [12,68,70] and the data analysis above.
This also indicates that the predicted results are reasonable. Moreover, for the designed alloy with a
maximum QI of 966 MPa, its UTS is 549 MPa, and EL is 16%, both of which are higher than all the available
experimental data. Although the designed results generally conform to the current experimental rules, their
accuracy still needs further experimental validation as the major target for the next publication.
CONCLUSIONS
● Based on an exhausting collection from 50 publications, a high-quality dataset for SLMed Al-Si-(Mg)
alloys (including Al12Si, Al10Si, AlSi10Mg, Al7Si, Al7SiMg, and Al4Si) with 176 pieces of data was