
Page 69 - Read Online
P. 69
Gao et al. J Mater Inf 2023;3:6 https://dx.doi.org/10.20517/jmi.2023.03 Page 7 of 15
Some data points with good performance in three alloy systems were selected and analyzed, as marked by
the purple circles in Figure 2. In general, from the current dataset, the promising Ed for Al-Si-(Mg) alloy is
3
3
roughly distributed between 45 J/mm and 55 J/mm . As the Si content increases, the suitable Ed value
decreases. It seems that the combination of 67° layer rotation and 0° test direction provide great
opportunities to obtain high-performance alloy. Based on the existing experimental dataset, the effect of
more manufacturing parameters (laser power, scan speed, hatch space, and layer thickness) on the
mechanical properties of SLMed Al-Si-(Mg) alloys were further investigated and analyzed, as shown in
Supplementary Figure 2. The suitable layer thickness is 30 μm~40 μm, while the suitable hatch space is 100 μ
m~130 μm. With the Si content decreasing, the suitable laser power varies from 250 W to 370 W, while the
suitable scan speed can vary from 1,800 mm/s to 1,300 mm/s.
Feature analysis
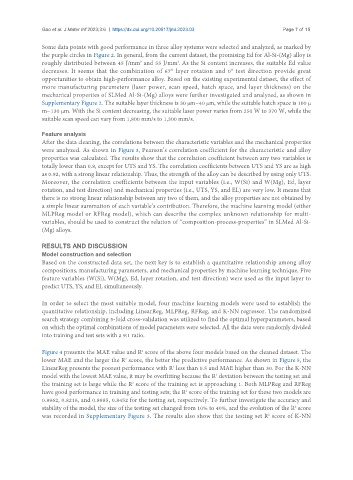
After the data cleaning, the correlations between the characteristic variables and the mechanical properties
were analyzed. As shown in Figure 3, Pearson’s correlation coefficient for the characteristic and alloy
properties was calculated. The results show that the correlation coefficient between any two variables is
totally lower than 0.8, except for UTS and YS. The correlation coefficients between UTS and YS are as high
as 0.92, with a strong linear relationship. Thus, the strength of the alloy can be described by using only UTS.
Moreover, the correlation coefficients between the input variables (i.e., W(Si) and W(Mg), Ed, layer
rotation, and test direction) and mechanical properties (i.e., UTS, YS, and EL) are very low. It means that
there is no strong linear relationship between any two of them, and the alloy properties are not obtained by
a simple linear summation of each variable’s contribution. Therefore, the machine learning model (either
MLPReg model or RFReg model), which can describe the complex unknown relationship for multi-
variables, should be used to construct the relation of “composition-process-properties” in SLMed Al-Si-
(Mg) alloys.
RESULTS AND DISCUSSION
Model construction and selection
Based on the constructed data set, the next key is to establish a quantitative relationship among alloy
compositions, manufacturing parameters, and mechanical properties by machine learning technique. Five
feature variables (W(Si), W(Mg), Ed, layer rotation, and test direction) were used as the input layer to
predict UTS, YS, and EL simultaneously.
In order to select the most suitable model, four machine learning models were used to establish the
quantitative relationship, including LinearReg, MLPReg, RFReg, and K-NN regressor. The randomized
search strategy combining 5-fold cross-validation was utilized to find the optimal hyperparameters, based
on which the optimal combinations of model parameters were selected. All the data were randomly divided
into training and test sets with a 9:1 ratio.
2
Figure 4 presents the MAE value and R score of the above four models based on the cleaned dataset. The
lower MAE and the larger the R score, the better the predictive performance. As shown in Figure 5, the
2
2
LinearReg presents the poorest performance with R less than 0.5 and MAE higher than 30. For the K-NN
model with the lowest MAE value, it may be overfitting because the R deviation between the testing set and
2
2
the training set is large while the R score of the training set is approaching 1. Both MLPReg and RFReg
have good performance in training and testing sets; the R score of the training set for these two models are
2
0.8962, 0.8216, and 0.8985, 0.8452 for the testing set, respectively. To further investigate the accuracy and
stability of the model, the size of the testing set changed from 10% to 40%, and the evolution of the R score
2
2
was recorded in Supplementary Figure 3. The results also show that the testing set R score of K-NN