
Page 67 - Read Online
P. 67
Gao et al. J Mater Inf 2023;3:6 https://dx.doi.org/10.20517/jmi.2023.03 Page 5 of 15
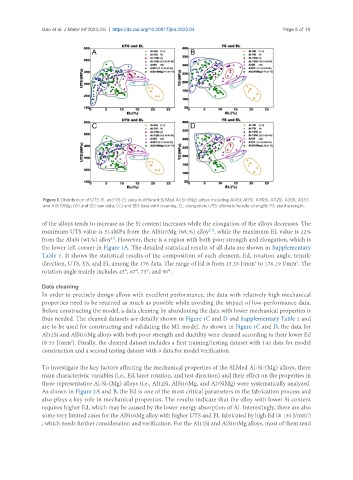
Figure 1. Distribution of UTS~EL and YS~EL data in different SLMed Al-Si-(Mg) alloys including Al4Si, Al7Si, Al10Si, Al12Si, A356, A357,
and AlSi10Mg: (A) and (B) raw data; (C) and (D) data with cleaning. EL: elongation; UTS: ultimate tensile strength; YS: yield strength.
of the alloys tends to increase as the Si content increases while the elongation of the alloys decreases. The
maximum UTS value is 514MPa from the AlSi10Mg (wt.%) alloy , while the maximum EL value is 22%
[77]
[4]
from the Al4Si (wt.%) alloy . However, there is a region with both poor strength and elongation, which is
the lower left corner in Figure 1A. The detailed statistical results of all data are shown in Supplementary
Table 1. It shows the statistical results of the composition of each element, Ed, rotation angle, tensile
direction, UTS, YS, and EL among the 176 data. The range of Ed is from 13.33 J/mm to 176.19 J/mm . The
3
3
rotation angle mainly includes 45°, 67°, 73°, and 90°.
Data cleaning
In order to precisely design alloys with excellent performance, the data with relatively high mechanical
properties need to be retained as much as possible while avoiding the impact of low-performance data.
Before constructing the model, a data cleaning by abandoning the data with lower mechanical properties is
thus needed. The cleaned datasets are detailly shown in Figure 1C and D and Supplementary Table 2 and
are to be used for constructing and validating the ML model. As shown in Figure 1C and D, the data for
Al12Si and AlSi10Mg alloys with both poor strength and ductility were cleaned according to their lower Ed
(≤ 35 J/mm ). Finally, the cleaned dataset includes a first training/testing dataset with 142 data for model
3
construction and a second testing dataset with 9 data for model verification.
To investigate the key factors affecting the mechanical properties of the SLMed Al-Si-(Mg) alloys, three
main characteristic variables (i.e., Ed, layer rotation, and test direction) and their effect on the properties in
three representative Al-Si-(Mg) alloys (i.e., Al12Si, AlSi10Mg, and Al7SiMg) were systematically analyzed.
As shown in Figure 2A and B, the Ed is one of the most critical parameters in the fabrication process and
also plays a key role in mechanical properties. The results indicate that the alloy with lower Si content
requires higher Ed, which may be caused by the lower energy absorption of Al. Interestingly, there are also
some very limited cases for the AlSi10Mg alloy with higher UTS and EL fabricated by high Ed (≥ 130 J/mm )
3
, which needs further consideration and verification. For the Al12Si and AlSi10Mg alloys, most of them tend