
Page 58 - Read Online
P. 58
Park et al. J Mater Inf 2023;3:5 https://dx.doi.org/10.20517/jmi.2022.37 Page 21 of 25
Figure 14. Enlarged sections of the Fe-Sn system: (A) Fe-rich region; (B) γ-loop; (C) Sn-rich region along with experimental
[29-32,34,35,41,43-46] [19,20]
data and thermodynamic assessments from literature. bcc: Body-centered cubic; DSC: Differential Scanning
Calorimetry; fcc: face-centered cubic.
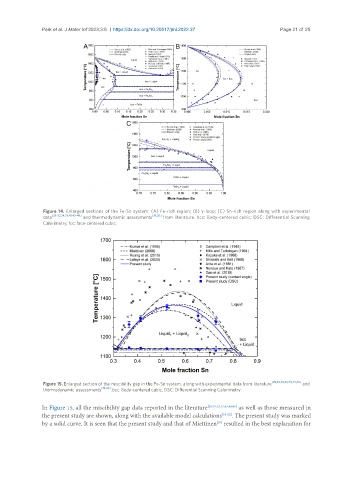
Figure 15. Enlarged section of the miscibility gap in the Fe-Sn system, along with experimental data from literature [29,30,32,33,43,44,46] and
thermodynamic assessments [19-22] . bcc: Body-centered cubic; DSC: Differential Scanning Calorimetry.
In Figure 15, all the miscibility gap data reported in the literature [29,30,32,33,43,44,46] as well as those measured in
the present study are shown, along with the available model calculations [19-22] . The present study was marked
by a solid curve. It is seen that the present study and that of Miettinen resulted in the best explanation for
[20]