
Page 53 - Read Online
P. 53
Page 16 of 25 Park et al. J Mater Inf 2023;3:5 https://dx.doi.org/10.20517/jmi.2022.37
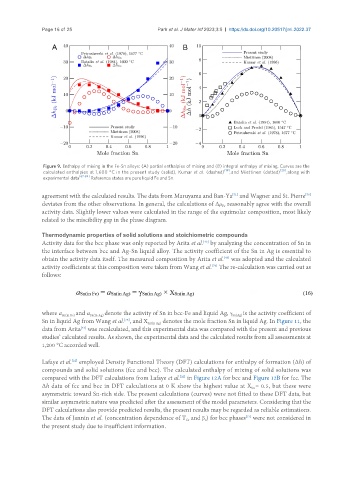
Figure 9. Enthalpy of mixing in the Fe-Sn alloys: (A) partial enthalpies of mixing and (B) integral enthalpy of mixing. Curves are the
[19] [20]
calculated enthalpies at 1,600 °C in the present study (solid), Kumar et al. (dashed) , and Miettinen (dotted) , along with
[67-69]
experimental data . Reference states are pure liquid Fe and Sn.
agreement with the calculated results. The data from Maruyama and Ban-Ya and Wagner and St. Pierre
[70]
[71]
deviates from the other observations. In general, the calculations of ∆μ reasonably agree with the overall
Fe
activity data. Slightly lower values were calculated in the range of the equimolar composition, most likely
related to the miscibility gap in the phase diagram.
Thermodynamic properties of solid solutions and stoichiometric compounds
[43]
Activity data for the bcc phase was only reported by Arita et al. by analyzing the concentration of Sn in
the interface between bcc and Ag-Sn liquid alloy. The activity coefficient of the Sn in Ag is essential to
obtain the activity data itself. The measured composition by Arita et al. was adopted and the calculated
[43]
activity coefficients at this composition were taken from Wang et al. The re-calculation was carried out as
[76]
follows:
where a Sn(in Fe) and a Sn(in Ag) denote the activity of Sn in bcc-Fe and liquid Ag, γ Sn(Ag) is the activity coefficient of
Sn in liquid Ag from Wang et al. , and X Sn(in Ag) denotes the mole fraction Sn in liquid Ag. In Figure 11, the
[76]
data from Arita was recalculated, and this experimental data was compared with the present and previous
[43]
studies’ calculated results. As shown, the experimental data and the calculated results from all assessments at
1,200 °C accorded well.
Lafaye et al. employed Density Functional Theory (DFT) calculations for enthalpy of formation (∆h) of
[22]
compounds and solid solutions (fcc and bcc). The calculated enthalpy of mixing of solid solutions was
[22]
compared with the DFT calculations from Lafaye et al. in Figure 12A for bcc and Figure 12B for fcc. The
∆h data of fcc and bcc in DFT calculations at 0 K show the highest value at X = 0.5, but these were
Sn
asymmetric toward Sn-rich side. The present calculations (curves) were not fitted to these DFT data, but
similar asymmetric nature was predicted after the assessment of the model parameters. Considering that the
DFT calculations also provide predicted results, the present results may be regarded as reliable estimations.
[77]
The data of Jannin et al. (concentration dependence of T and β ) for bcc phases were not considered in
0
Cr
the present study due to insufficient information.